Evolution of transport infrastructure investments since before the financial crisis
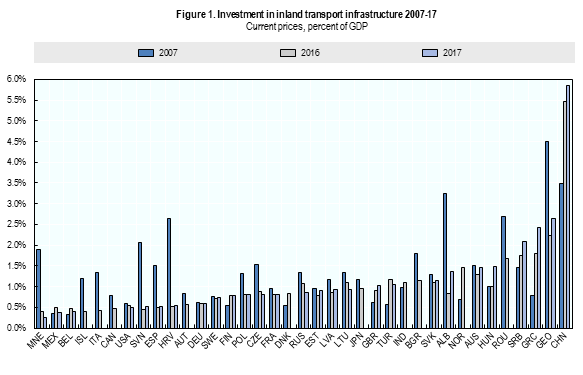
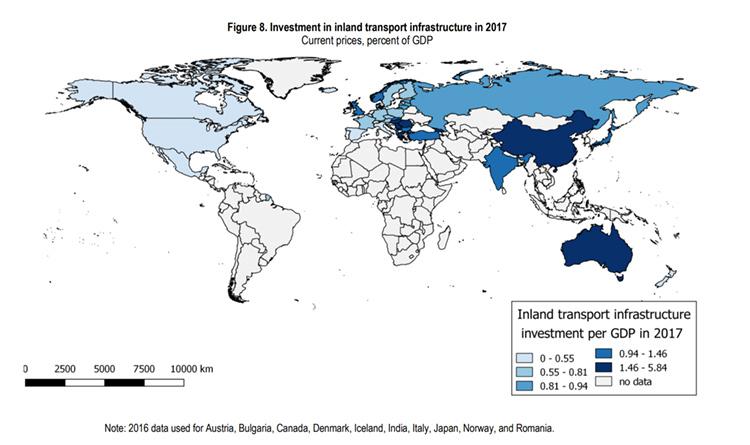
- China has the highest inland transport infrastructure investment share of GDP among ITF countries with available data in 2017 (5.8%).
- In Europe, the inland transport infrastructure investment share of GDP has remained stable at 0.8% since 2012 (1), which is only a slight decrease from its pre-crisis level of 0.9% in 2007.
- Albania, Croatia, Georgia, Montenegro and Slovenia experienced the strongest declines in inland transport infrastructure investment share of GDP in 2007-17, decreasing over 1.5 percentage points.
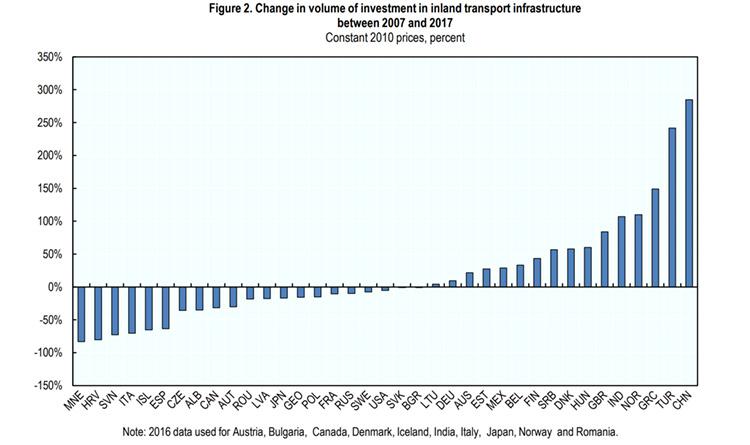
- The People’s Republic of China has nearly quadrupled its volume of investment in inland transport infrastructure since 2007 (+290%) and Turkey more than tripled investments (+240%).
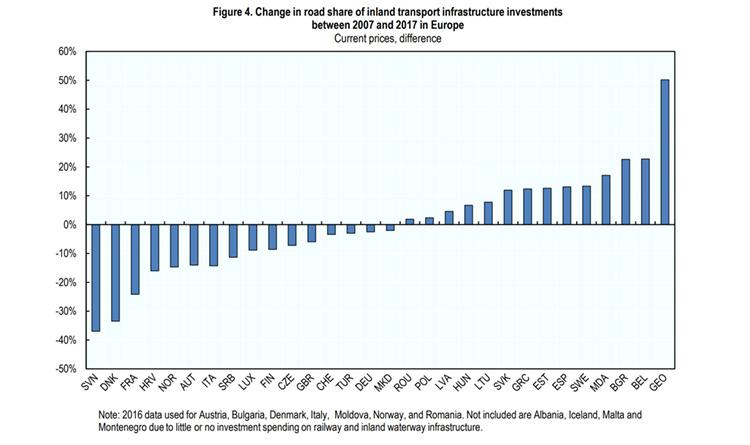
- The largest increase in the road share of inland transport infrastructure investment in 2007-17 was recorded in Georgia (37% to 87%). This is due to simultaneous growth in road investments (+100%) and declines in railway investments (-82%).
- North America decreased its road share of inland transport infrastructure investments from 2007 to 2017. In Mexico, the road share fell 23 percentage points due to strong growth of investment in rail (+171%). In Canada the share of road investment declined by 4 percentage points, in the United States by 3 percentage points.
- China is developing its road network at a faster rate than its railways, when comparing volume of spending in 2017 to 2007 (+336% and +141% respectively).
Investment trends for inland transport infrastructure
The highest gross fixed capital formation (investment) in inland transport infrastructure expressed as a percentage of the Gross Domestic Product (GDP) in 2017 occurred in China (5.8%), Georgia (2.6%), Greece (2.4%) and Serbia (2.1%) (Figure 1). Between 2016 and 2017, the largest increases in inland transport infrastructure investment shares of GDP were recorded in Greece (+0.6), Albania (+0.5), Hungary (+0.5), Georgia (+0.4) and China (+0.4). When comparing the latest data to 2007 pre-crisis levels, there was visible growth in inland transport infrastructure investment shares of GDP in China, Denmark, Finland, Greece, Hungary, India, Norway, Serbia, Turkey and the United Kingdom. Among these, China experienced the fastest growth for this indicator, increasing 2.4 percentage points since before the financial crisis. The European inland transport infrastructure investment share of GDP has remained stable at 0.8% since 2012 (2), which is only a slight decrease from its pre-crisis level of 0.9% in 2007.
The lowest levels of inland transport infrastructure investment share of GDP for 2017 were reported in Montenegro (0.3%), Mexico, Belgium, Iceland and Italy (all 0.4%). The most notable declines from 2016 to 2017 occurred in the Russian Federation (1.0% to 0.8%) and Lithuania (1.1% to 0.9%). Seventeen countries across Europe as well as Canada, Japan and the Russian Federation, had lower levels of inland transport infrastructure investment share of GDP in 2017 when compared to 2007 levels. Among these, a subset of CEECs and Georgia experienced the strongest declines; Albania, Croatia, Georgia, Montenegro and Slovenia all decreased investment’s share of GDP by over 1.5 percentage points from before the financial crisis to 2017. Despite the decline in Georgia, its inland infrastructure investment share of GDP was one of the highest of all countries with available data in 2017 at 2.6%, second only to China.
China and India are among the top five countries that experienced the strongest growth since 2007, according to the latest available data on volumes of investment in inland transport infrastructure (Figure 2). China has experienced consistent growth since 2011 (Figure 3) and has nearly quadrupled its volume of investment since 2007 (+290%). Despite the recent stagnation of inland transport infrastructure investments in India, its volume of spending was nevertheless two times larger in 2016 when compared to 2007 levels. The European countries with the strongest growth in investment in inland transport infrastructure between 2007 and 2017 are Turkey, Greece, Norway, and the United Kingdom (Figure 2). Most notably, Turkey more than tripled its spending (+240%) and Greece more than doubled its spending (+150%) during the referenced period. The strongest declines in volumes of investment in inland transport infrastructure (in constant 2010 prices) for the same period were in Montenegro, Croatia (both -80%), Slovenia, Italy, Iceland (all -70%) and Spain (-60%).

Shifts in investments between road and rail
In Western, Central and Eastern Europe, there are contrasting trends in the evolution of the share of inland transport infrastructure investment used for road over the past decade (Figure 4). The largest increase in road share of inland transport infrastructure investment took place in Georgia, where it grew from 37% (2007) to 87% (2017). During the referenced years, railway investments in Georgia (in constant euros) decreased by 82% while road investments doubled. The most significant declines in share of spending on roads when comparing 2017 to 2007 were Slovenia decreasing by 37 percentage points (91% to 55%), Denmark by 33 percentage points (82% to 48% in 2016) and France by 24 percentage points (74% to 50%). In terms of volumes of expenditure in constant euros, Slovenia (-84%) and France (-40%) spent less on roads and more on rail (+45% and +76% respectively).
The most notable modal shift in inland transport infrastructure investments between 2007 and 2017 among the selected countries in Figure 5 is a decrease of 23 percentage points in the share of spending on roads in Mexico (79% to 57%). In constant euros, railway investments grew 171% in Mexico compared to the previous decade and road investments decreased slightly (-8%). China and the Russian Federation experienced visible increases in their shares of road investments for the period referenced (+10 and +12 percentage points respectively), but for different reasons. While the Russian Federation trend stems from a decline in rail investments (-35%), in China the trend was due to stronger growth in road investment (+336%) compared to that of rail (+141%).

Road maintenance
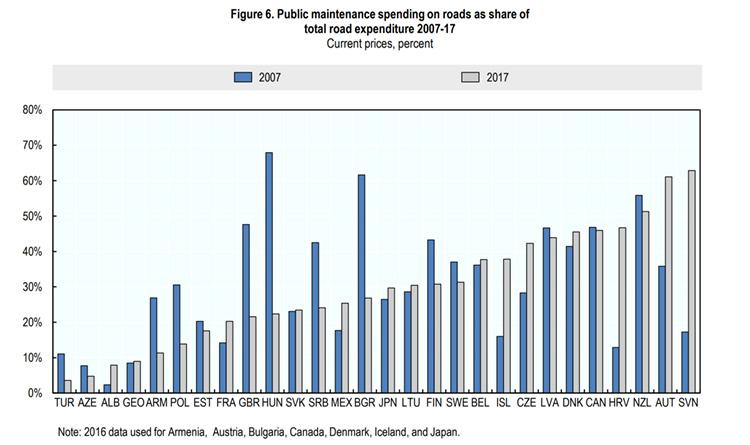
In 2017, Slovenia and Austria had the highest public maintenance spending on roads as a share of total road expenditure (63% and 61% respectively), while Turkey (4%) and Azerbaijan (5%) had the lowest shares (among countries in Figure 6). The most notable increases in shares of public maintenance spending on roads in 2017 compared to before the financial crisis occurred in Slovenia (17% to 63%), Croatia (13% to 47%), Austria (36% to 61%), Iceland (16% to 38%) and the Czech Republic (28% to 42%). However, the increase in Croatia was due to a decrease in road infrastructure investments (-84%; in constant 2010 prices) more so than a growth in public maintenance spending on roads, which actually declined slightly between 2007 and 2017. In constant euros, public maintenance spending on roads increased the most between 2007 and 2017 in Belgium (+269%), Albania (+132%), and Georgia (+112%).
The largest declines in public maintenance spending on roads as a share of total road expenditure in 2017 compared to 2007 were in Hungary (68% to 22%), Bulgaria (62% to 27%), the United Kingdom (48% to 22%), Serbia (43% to 24%) and Poland (31% to 14%). In constant euros, these countries also have the most notable decreases in public maintenance spending on roads for the referred years, with Hungary experiencing the strongest decline (-76%). Between 2007 and 2017, most of these countries also showed notable growth in road investments in constant euros (Bulgaria +97%, Hungary +77%, the United Kingdom +59%, Serbia +38%), which further contributed to their decreased public maintenance road share.
Capital value of roads
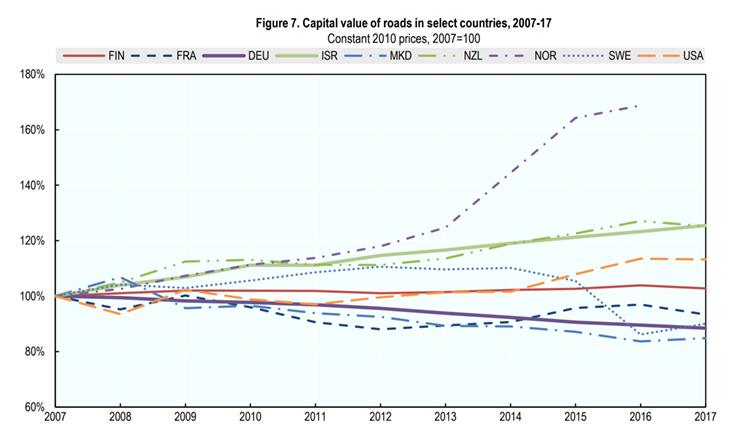
Among the ITF countries with substantial time series for the capital value of roads, Norway experienced the most visible growth between 2007 and 2016, increasing nearly 70% (Figure 7). In 2017, Israel (+26%) (3), New Zealand (+25%), the United States (+13%) and Finland (+3%) all reported higher capital value of roads compared to 2007. The latest data show slight decreases in capital value of roads in France (-7%), Sweden (-10%), Germany (-12%) and North Macedonia (-15%) since before the financial crisis.
About the statistics
The International Transport Forum statistics on investment, maintenance expenditure and capital value of transport infrastructure for 1995-2017 are based on a survey sent to current ITF member countries. The survey covers total gross investment (defined as new construction, extensions, reconstruction, renewal and major repair) in road, rail, inland waterways, maritime ports and airports, including all sources of financing. It also covers maintenance
expenditures financed by public administrations and capital value of transport infrastructure.
The Secretariat has collected and published data on this topic since the late 1970s. Member countries supply data in their national currency and the data are then converted to current euros and constant euros. The Secretariat has devoted significant efforts to collecting relevant deflators needed to calculate the constant euro equivalent of data provided, since there exists no purchasing power parity corrected general index for transport infrastructure
investment. Where available, a cost index for construction on land and water is used. Where these indices are not available, a manufacturing cost index or a GDP deflator is used.
Despite the relatively long time series, these data are often dogged by definition and coverage inconsistencies between countries, which make international comparisons difficult. For the capital value data in particular, there are
notable differences in precision of estimation methods (4). We therefore advise caution when making comparisons of data between countries and instead recommend comparisons of trends. Furthermore, when analysing the capital value data or indicators such as the inland transport infrastructure investment share of GDP, it is important to take into account the quality and age of existing infrastructure, the maturity of the transport system, the geography of the country, the transport-intensity of its productive sector and its transport infrastructure developments.
Detailed country data for inland modes, maritime ports and airports along with more detailed data descriptions and notes on the methodologies are available at: https://stats.oecd.org/Index.aspx?DataSetCode=ITF_INV-MTN_DATA
If you would like to receive more information about this Statistics Brief, please contact Ms Ashley Acker.
Notes
(1) The aggregate for Europe includes Albania, Austria, Belgium, Bulgaria, Croatia, the Czech Republic, Denmark, Estonia, Finland, France, Germany, Greece, Hungary, Iceland, Italy, Latvia, Lithuania, Montenegro, Norway, Poland, Romania, Serbia, Slovakia, Slovenia, Spain, Sweden, Turkey, and the United Kingdom. Data from 2016 was used for Austria, Bulgaria, Denmark, Iceland, Italy, Norway, and Romania.
(2) The aggregate for Europe includes Albania, Austria, Belgium, Bulgaria, Croatia, the Czech Republic, Denmark, Estonia, Finland, France, Germany, Greece, Hungary, Iceland, Italy, Latvia, Lithuania, Montenegro, Norway, Poland, Romania, Serbia, Slovakia, Slovenia, Spain, Sweden, Turkey, and the United Kingdom. Data from 2016 was used for Austria, Bulgaria, Denmark, Iceland, Italy, Norway, and Romania.
(3) The statistical data for Israel are supplied by and under the responsibility of the relevant Israeli authorities. The use of such data by the OECD/ITF is without prejudice to the status of the Golan Heights, East Jerusalem and Israeli settlements in the West Bank under the terms of international law.
(4) The capital value of infrastructure is most commonly estimated using historical cost accounting with the perpetual inventory method (PIM) or current cost accounting, which evaluates the current value of all assets.