Global shocks reshape trade routes and supply chains
Download the Statistics Brief as a visual PDF
War in Ukraine stifles post-pandemic trade recoveries in Europe and the United States
The ongoing war in Ukraine has reconfigured how goods are transported around the world. The latest data collected by the ITF confirm the war's negative impact on the quantity of global trade, which continues to lag below pre-pandemic levels in some regions. ITF analysis also reveals the agility of the global transport systems in response to shocks and disruptions.
By 2023, trade between the 27 member states of the European Union (EU27) and the rest of the world had yet to return to pre-pandemic levels. However, trade between the United States and the rest of the world was higher in early 2023 than in February 2020.
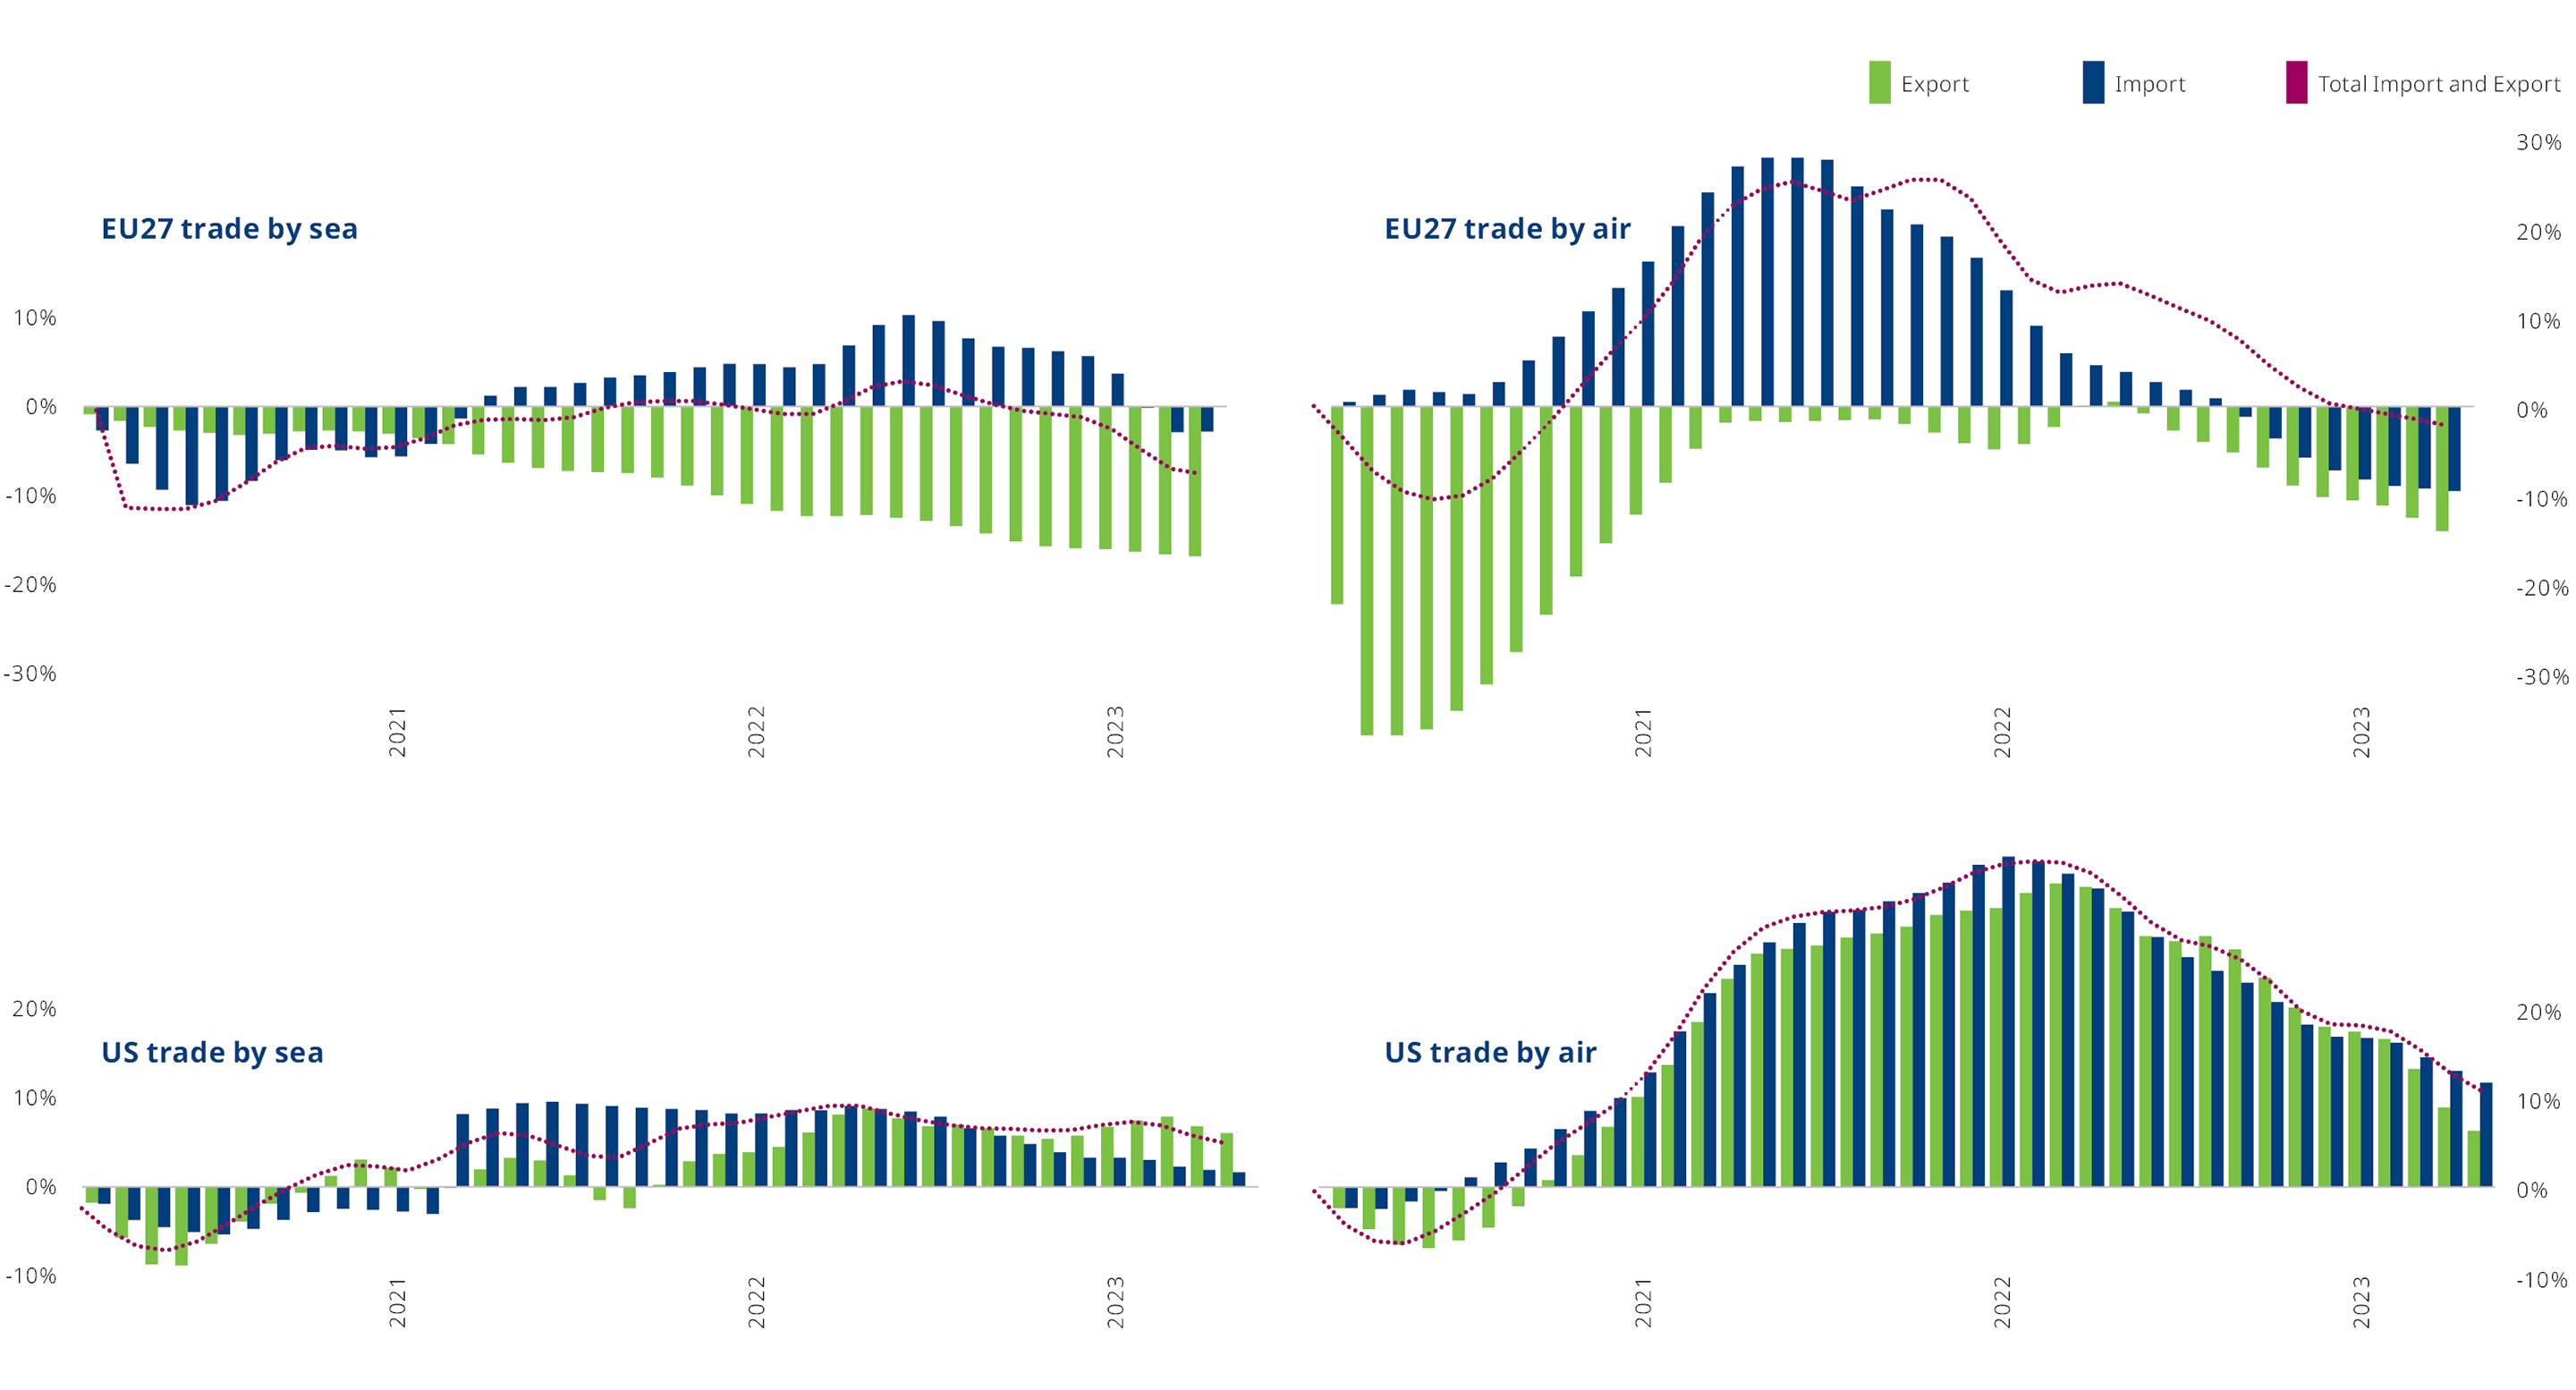
EU27 exports by sea transport – favoured for heavy, bulk resource commodities – have been decreasing since the beginning of the pandemic and continue to reflect sluggish economic growth affecting export-oriented industries. The latest data, for April 2023, show sea-borne exports 17% lower than pre-pandemic levels in February 2020. Imports to the EU27 by sea were heavily impacted by the pandemic but quickly recovered. Sea imports suffered a second shock at the start of the war in Ukraine (February 2022), decreasing 3% below pre-pandemic levels by April 2023.
The war in Ukraine heavily impacted EU27 imports by air (a mode typically used for higher-value finished products). In April 2023, imports were 10% lower than in February 2020. Exports by air showed resilience during the first months of the conflict but have slowly decreased to drop below the pre-pandemic levels of February 2020 by 15% in April 2023.
By contrast, trade between the United States and the rest of the world has proven more resilient to these double global shocks, although the second half of 2022 showed contraction. US imports (2%) and exports (7%) by sea remain above pre-pandemic levels in May 2023. Air imports (12%) and exports (7%) to and from the United States have been slowly contracting since the beginning of the pandemic but remained above pre-pandemic levels in May 2023.
The pandemic and the war in Ukraine have dealt twin blows to Europe's sea and air trade volumes
Percentage change in EU27 external trade since February 2020 (monthly trend, seasonally adjusted)
War severely disrupts trade between Europe and Eurasia
While the volume of goods transported between Europe and Eurasia by rail rapidly increased following the Covid-19 pandemic, the war in Ukraine caused an overall drop in trade by rail between Europe and its neighbours.
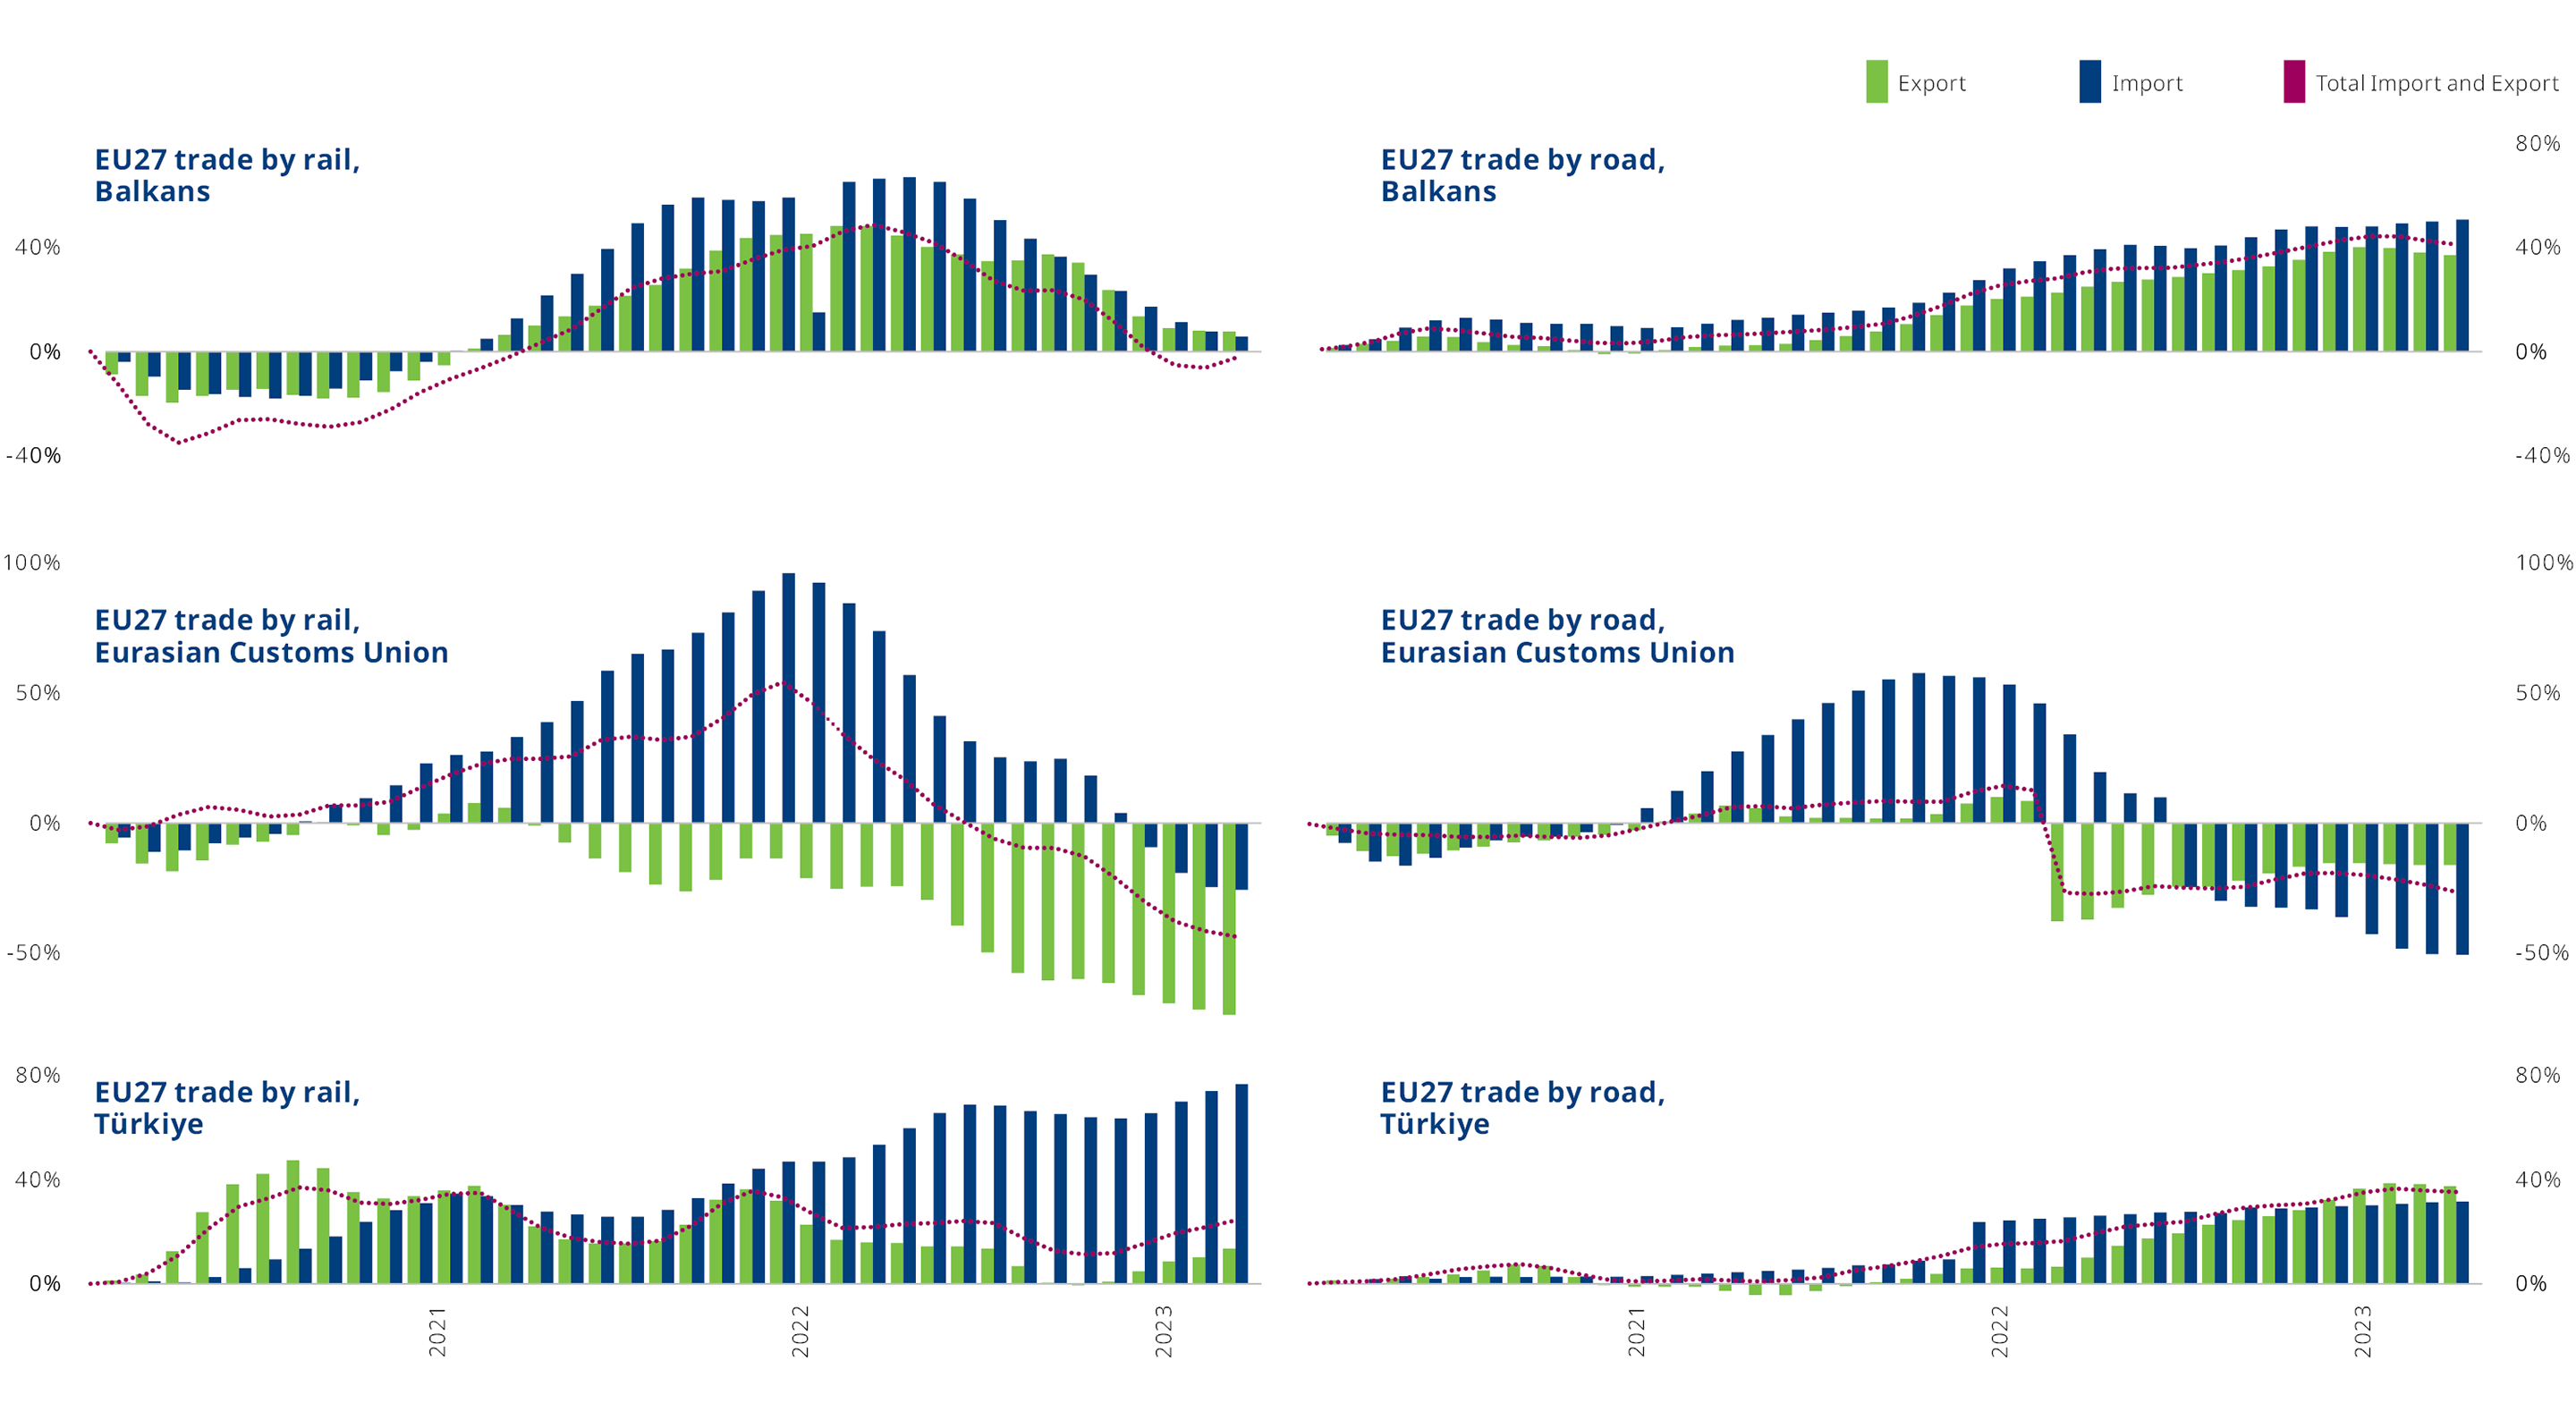
Not surprisingly, trade between the EU27 and the Eurasian Customs Union (Armenia, Belarus, Kazakhstan, Kyrgyzstan and Russia) was most affected: exports from Europe by rail drastically fell while imports have been slowly decreasing since the beginning of the war. In April 2023, exports were 73% below February 2020 levels, while imports fell 26% below February 2020 levels.
The latest data highlights road transport's resilience during the pandemic, with EU27 trade by trucks remaining almost stable in 2020 and 2021. Similar to rail, road trade with Eurasian Custom Unions countries was heavily affected by the war in Ukraine, showing a contraction in April 2023 of 50% in imports and 16% in exports compared to February 2020. EU27 trade with the Balkan countries and with Türkiye increased in early 2023, in contrast to exports and imports between the EU27 and the Eurasian Customs Union.
Road- and rail-based trade between Europe and Eurasia has plummeted; rail volumes rise elsewhere
Percentage change in EU27 external trade since February 2020 (monthly trend, seasonally adjusted)
US rail and road trade show clear signs of post-pandemic improvement
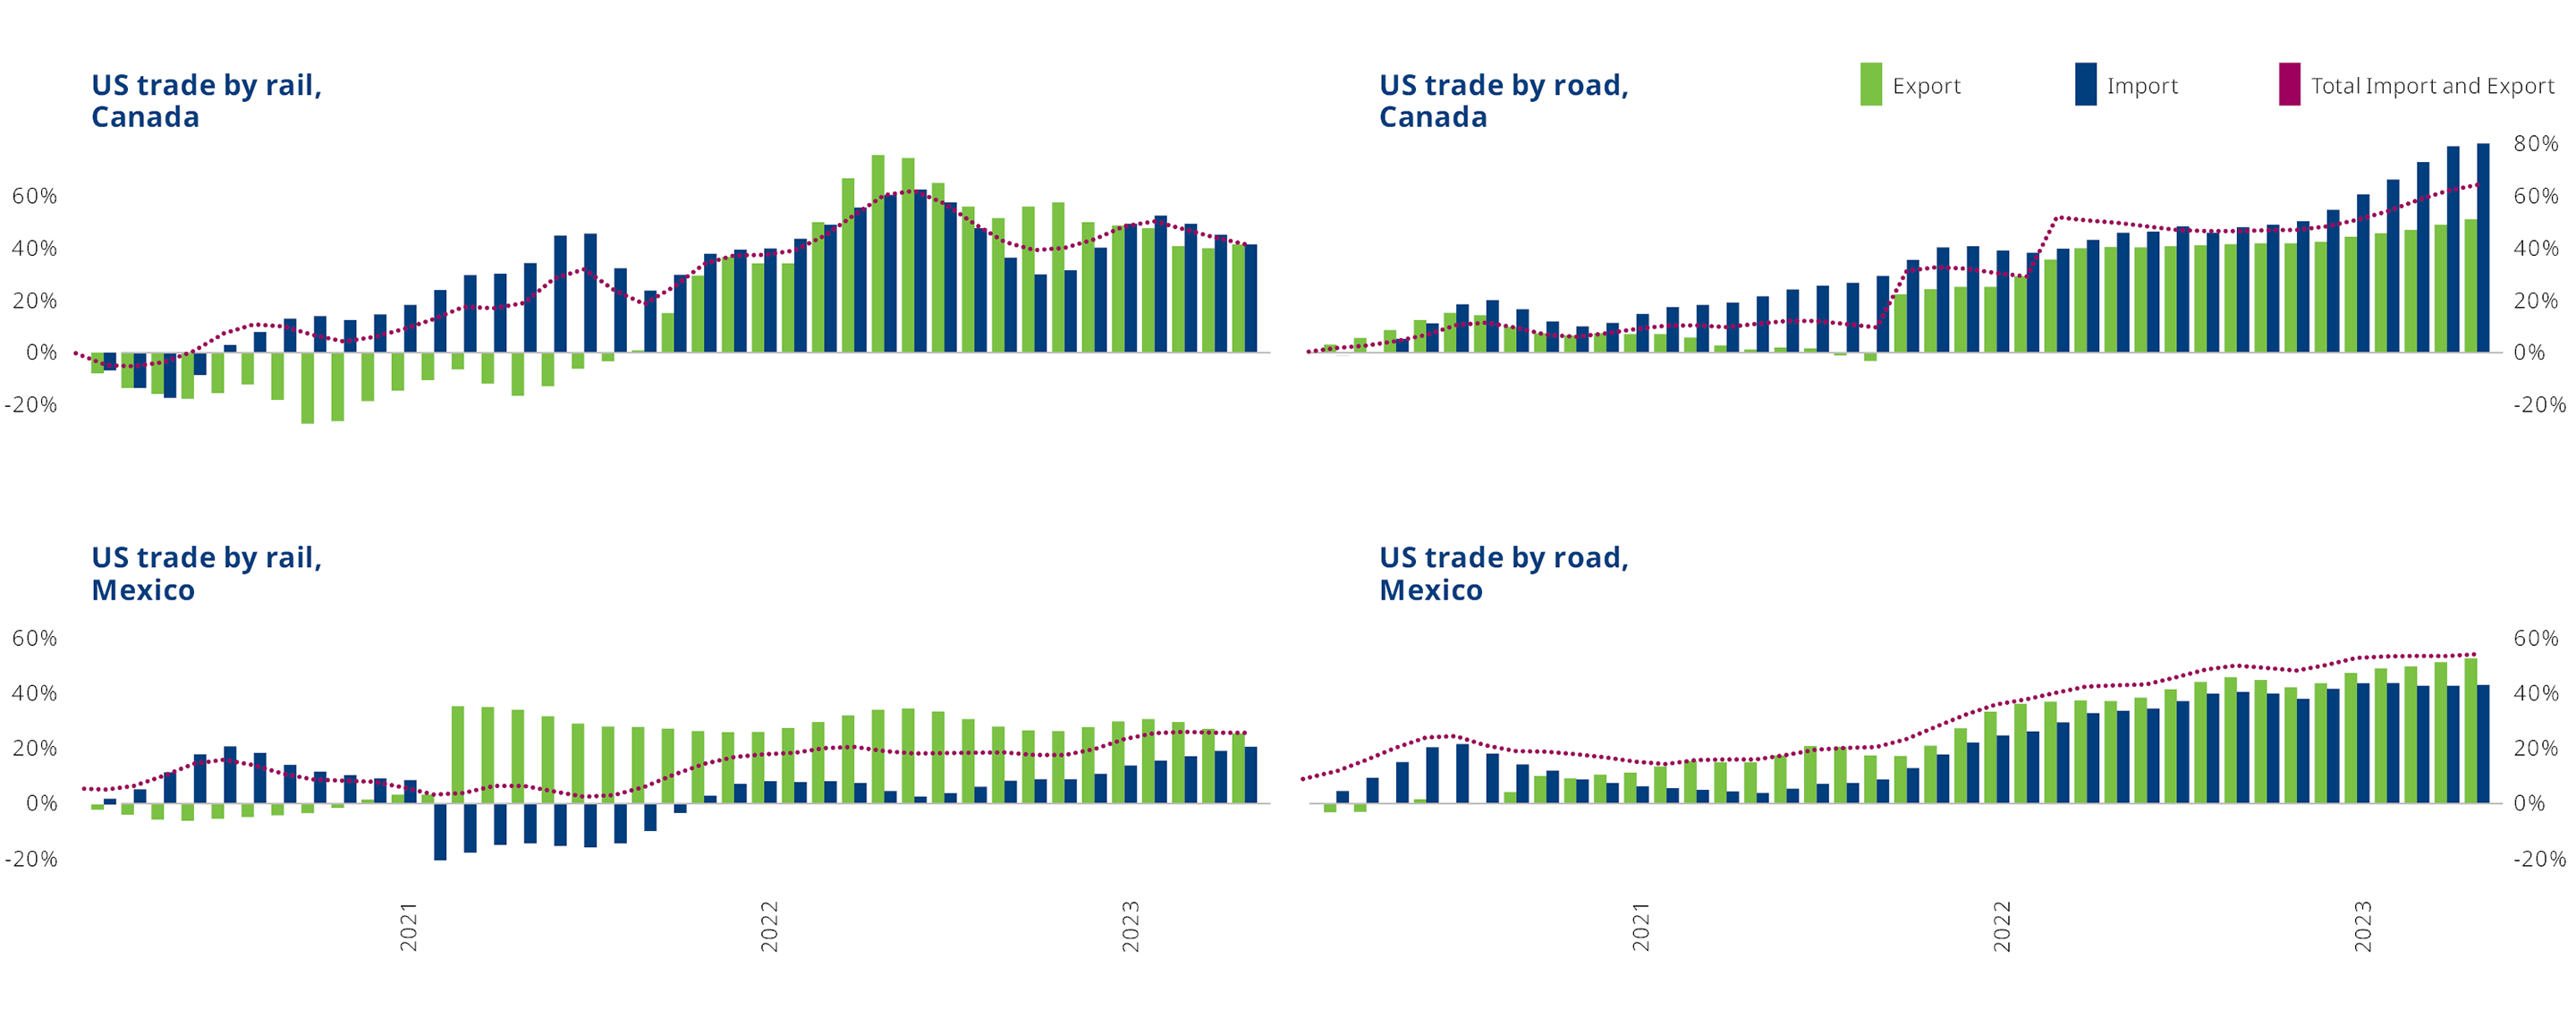
Rail and road trade between the United States and its neighbours have shown clear signs of improvement since the pandemic, maintaining their momentum despite the war in Ukraine. In May 2023, total rail trade with Canada increased by 19% and 14% with Mexico compared to February 2020. Similarly, total road trade registered a 29% increase with Canada and a 31% increase with Mexico.
Road- and rail-based trade between the United States and its neighbours continues to surge
Percentage change in EU27 external trade since February 2020 (monthly trend, seasonally adjusted)
US stagflation leads to drop in imports
Transport data show how high inflation coupled with low economic growth in the United States have caused consumer demand to drop, resulting in extraordinary inventory gluts and incentivising firms to reduce their inventories.
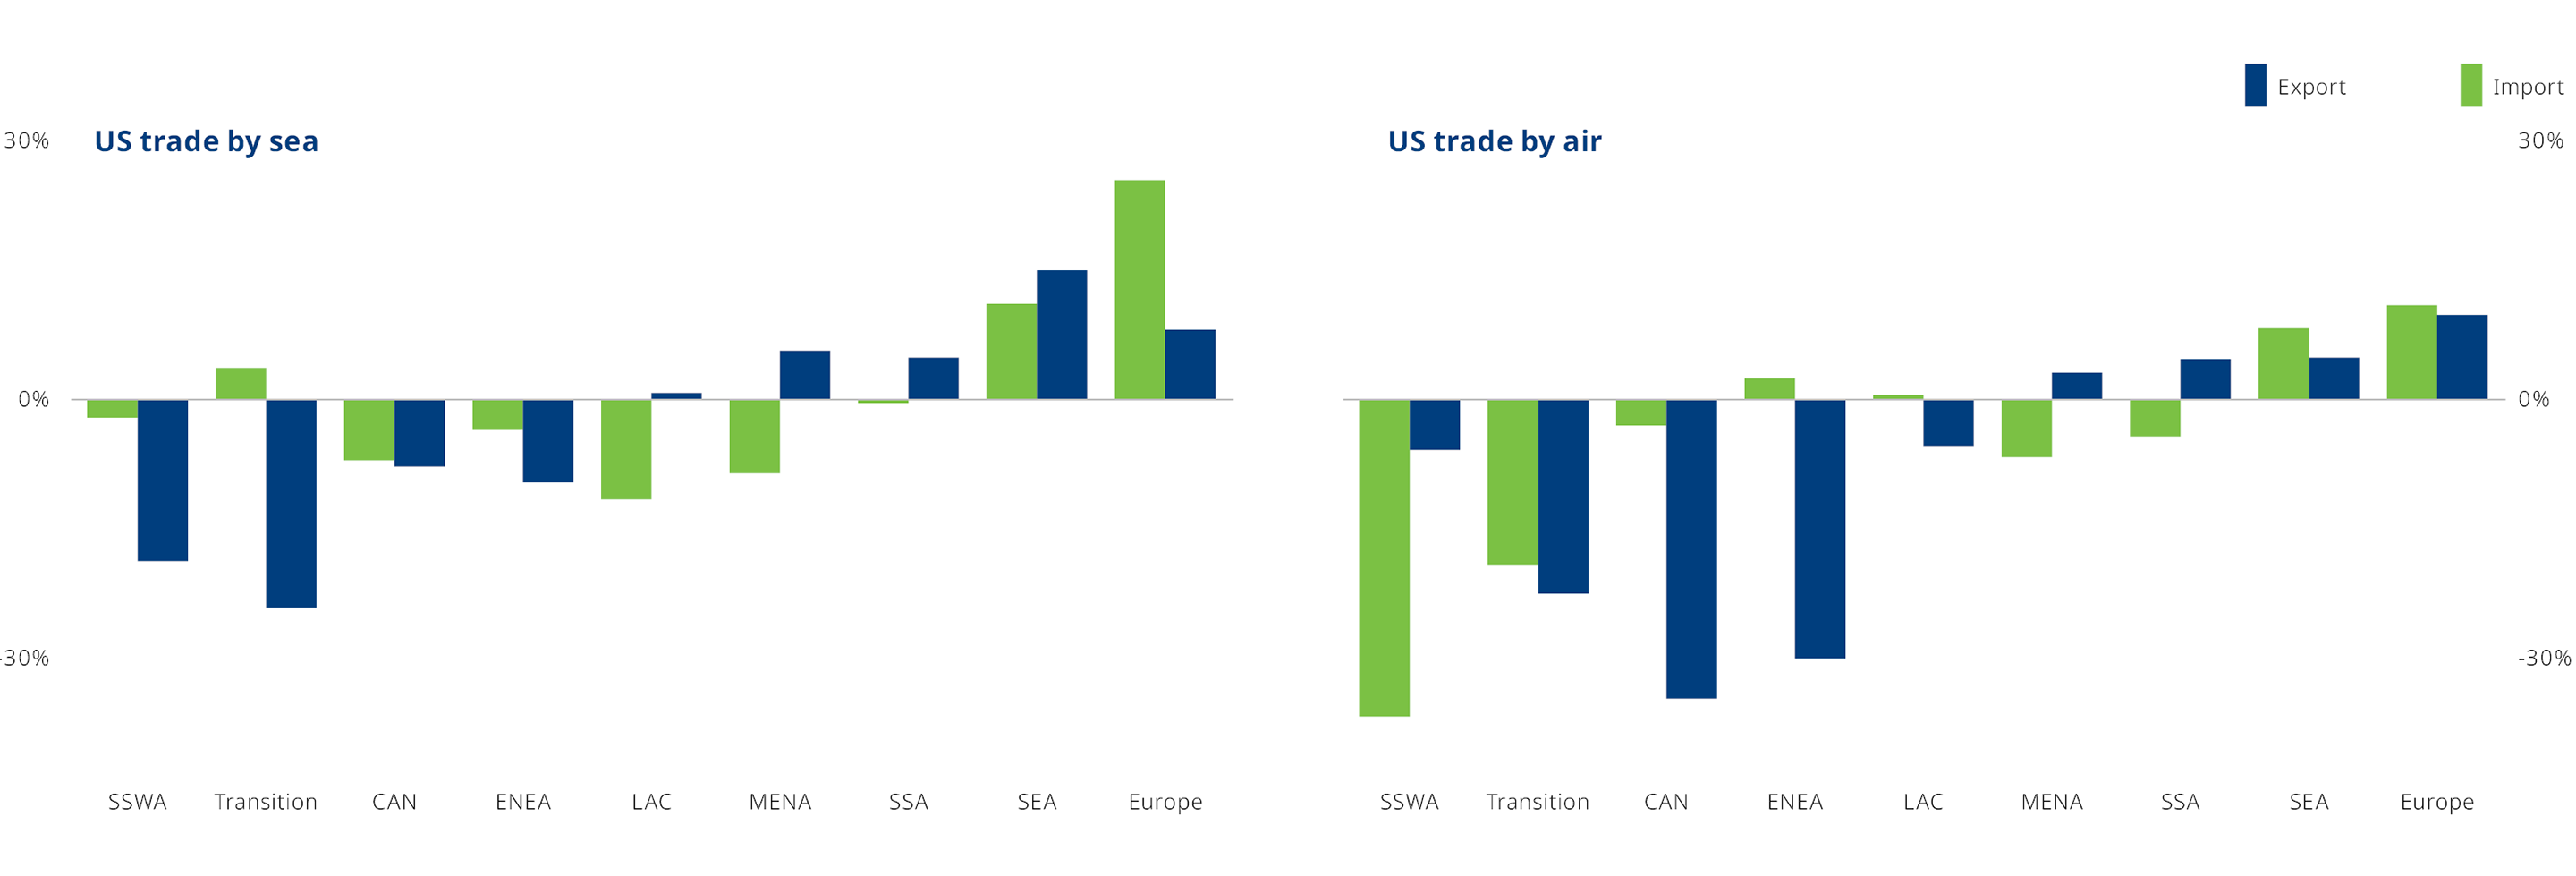
This economic picture explains why imports are more affected than exports. The reduction in imports transported into the US does not suggest a long-term trend but rather a temporary response to the current supply excess in the United States. US seaborne trade with transition economies – which include Belarus and the Russian Federation – varies when comparing between Q4 2021 and Q4 2022. Imports contracted by 25%, while exports grew by 4%. This data reflects relatively low levels of economic integration between transition economies and the United States before the war.
Sea trade with major regions such as Canada, Australia and New Zealand (grouped in this analysis as CAN), East and Northeast Asia (ENEA), and South and Southwest Asia (SSWA) also fell between Q4 2021 and Q4 2022. Since the onset of the war in Ukraine, the United States' external trade by air has contracted more than sea trade. Trade with transition economies remains the most affected flow, particularly exports, with a 40% contraction. ENEA, Southeast Asia (SEA) and SSWA all saw their trade with the United States reduced. As for sea trade, imports were the most affected.
US sea exports to Europe have risen substantially, while air exports to transition economies have plummeted
Percentage change in trade volumes (kilogrammes) between Q4 2021 and Q4 2022 by country group
Trade in goods between Europe and transition economies stalls: Commodity routes shift
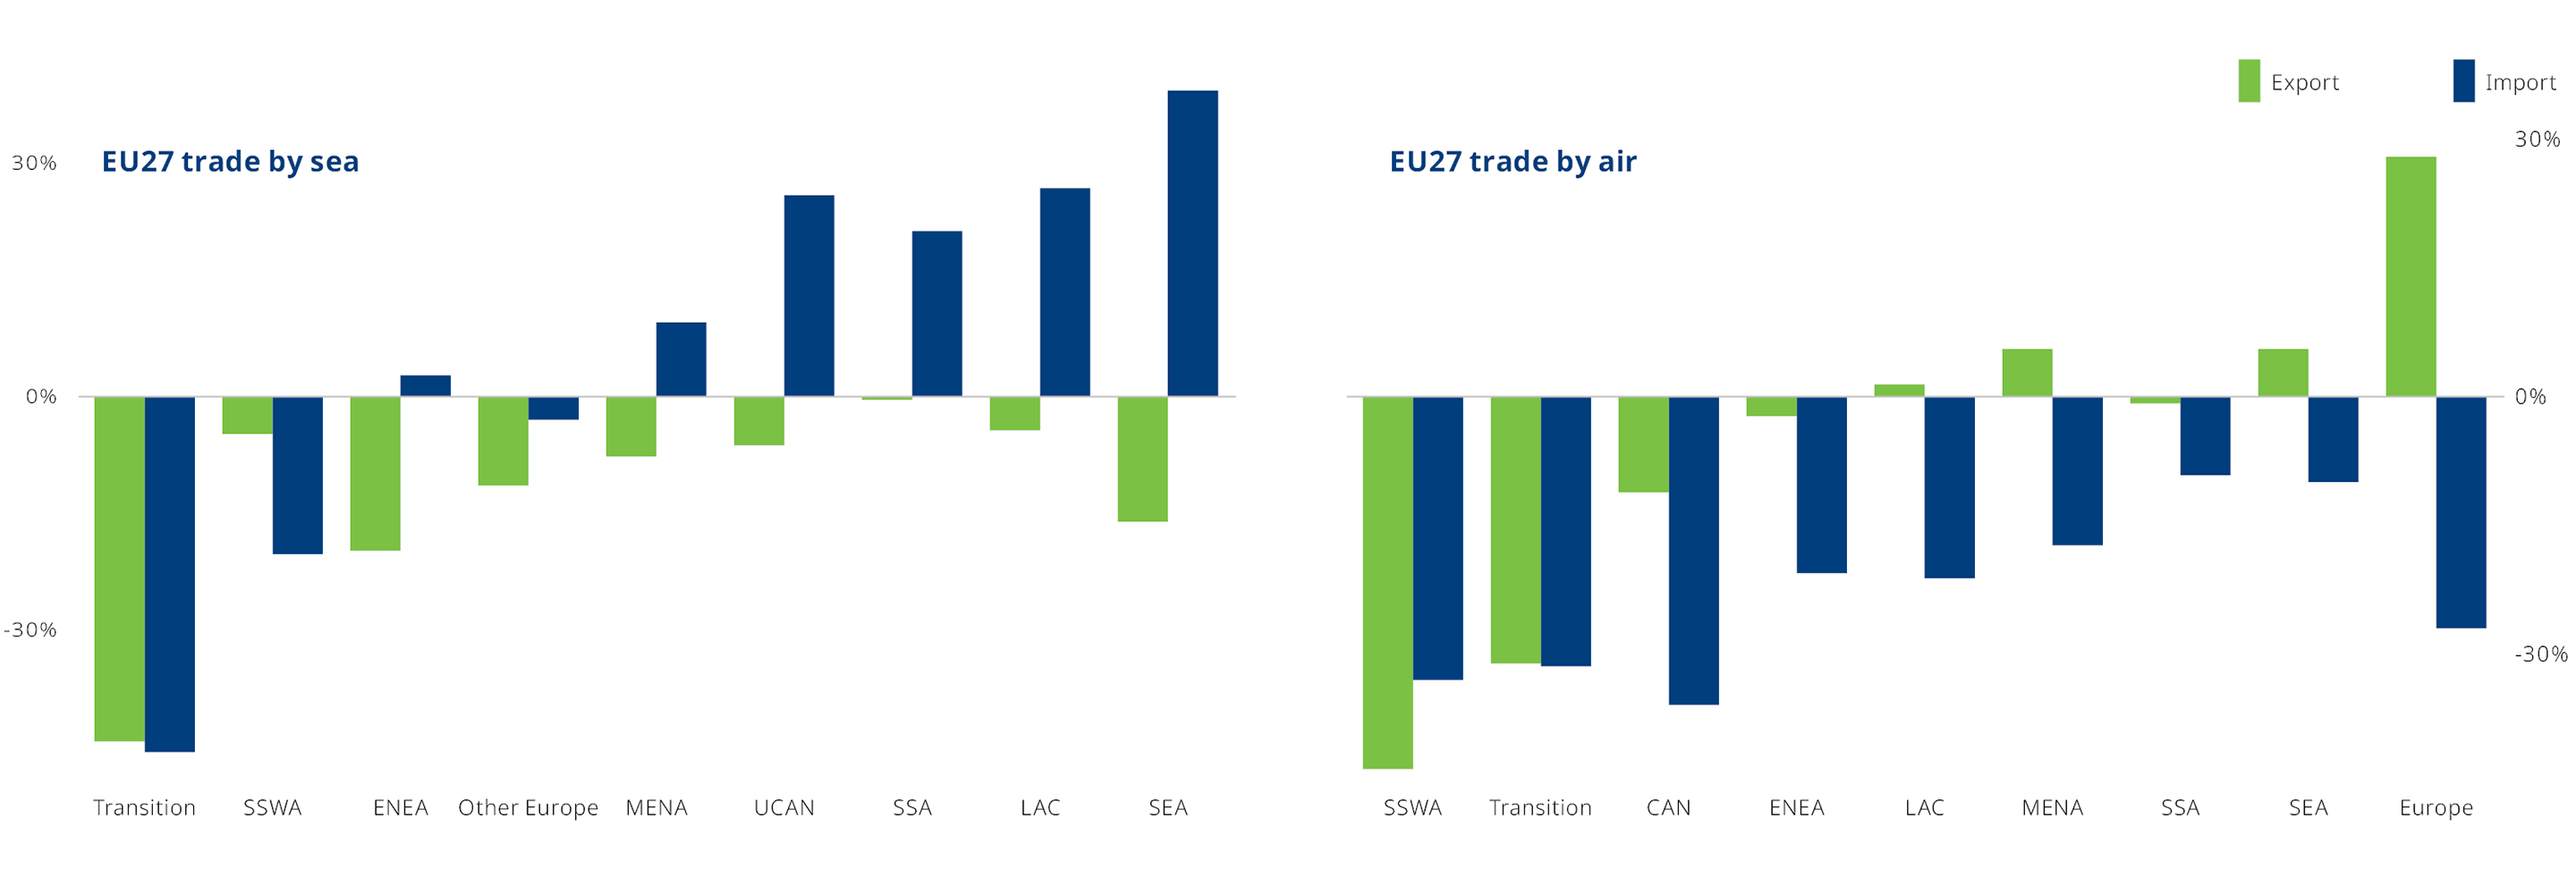
Sea trade between the EU27 and transition economies almost halved due to the war in Ukraine. Imports decreased by 47% and exports by 46% between Q4 2021 and Q4 2022.
Increased imports from resource-rich countries, including countries in Latin America and the Caribbean (LAC, 28% total) and SEA (40% total increase), as well as from the United States, Canada, Australia and New Zealand (UCAN, 27% combined increase), point to a possible trade shift to face the commodity shortage caused by the war. Seaborne exports to all regions show a general contraction.
Airborne EU27 trade also dropped over this period. Airspace bans caused by the war have particularly affected goods moved by air between EU27 and transition economies and ENEA. Longer routes to avoid using Russian airspace have increased transport costs, making exports more expensive. Exports to transition economies fell by 52% and by 37% to ENEA countries. Imports showed similar reductions, falling by 47% from transition economies and 37% from ENEA countries.
However, during the same period, airborne exports to LAC (7%), non-EU27 European countries (33%), SEA (7%), and Sub-Saharan Africa (SSA) (2%) increased.
Europe’s trade with transition economies has fallen dramatically, with exports to Southeast Asia surging
Percentage change in trade volumes (kilogrammes) between Q4 2021 and Q4 2022 by country group
Spotlight: Commodities trade shows Europe boosting clean energy capacity
The latest data on traded commodities show how the shock of the war in Ukraine has affected the movement of goods and supply chains worldwide.
The data allow a comparison of trade for the top five most valuable commodities traded between the EU27 and transition economies – including Belarus and Russia – and the change in the same commodities traded between the EU27 and all regions.
Commodity groupings that include materials vital for developing clean energy technology, such as nickel, which Russia exports, are the only of the five most valuable airborne imports from transition economies that increased (82%) between Q4 2021 and Q4 2022.
The war-induced fossil fuel shortages and efforts to meet climate goals have intensified Europe's need to transition more rapidly to clean energy.
About this data visualisation
The figure compares EU27 trade with all regions and with transition economies, showing the percentage change in trade between Q4 2021 and Q4 2022.
- The top-left square of the Cartesian plane shows commodities traded more with transition economies and less with all regions.
- The top-right square shows commodities that the EU27 traded more with transition economies and with all regions, showing supply chain resilience and a possible trade shift away from Russia towards other transition economies.
- In the bottom-left square are the commodities that experienced a decreased trade with transition economies and with all regions. This square mostly represents commodities with weak supply chains and goods that are not of vital importance to EU27 countries.
- The bottom-right square shows commodities that were less traded with transition economies but for which total trade with all regions was positive. This square suggests trade shifts from transition economies to other regions.

Comparison of EU27 trade with all regions and with transition economies for the top five commodities
Percentage change between Q4 2021 and Q4 2022 (tonnes)
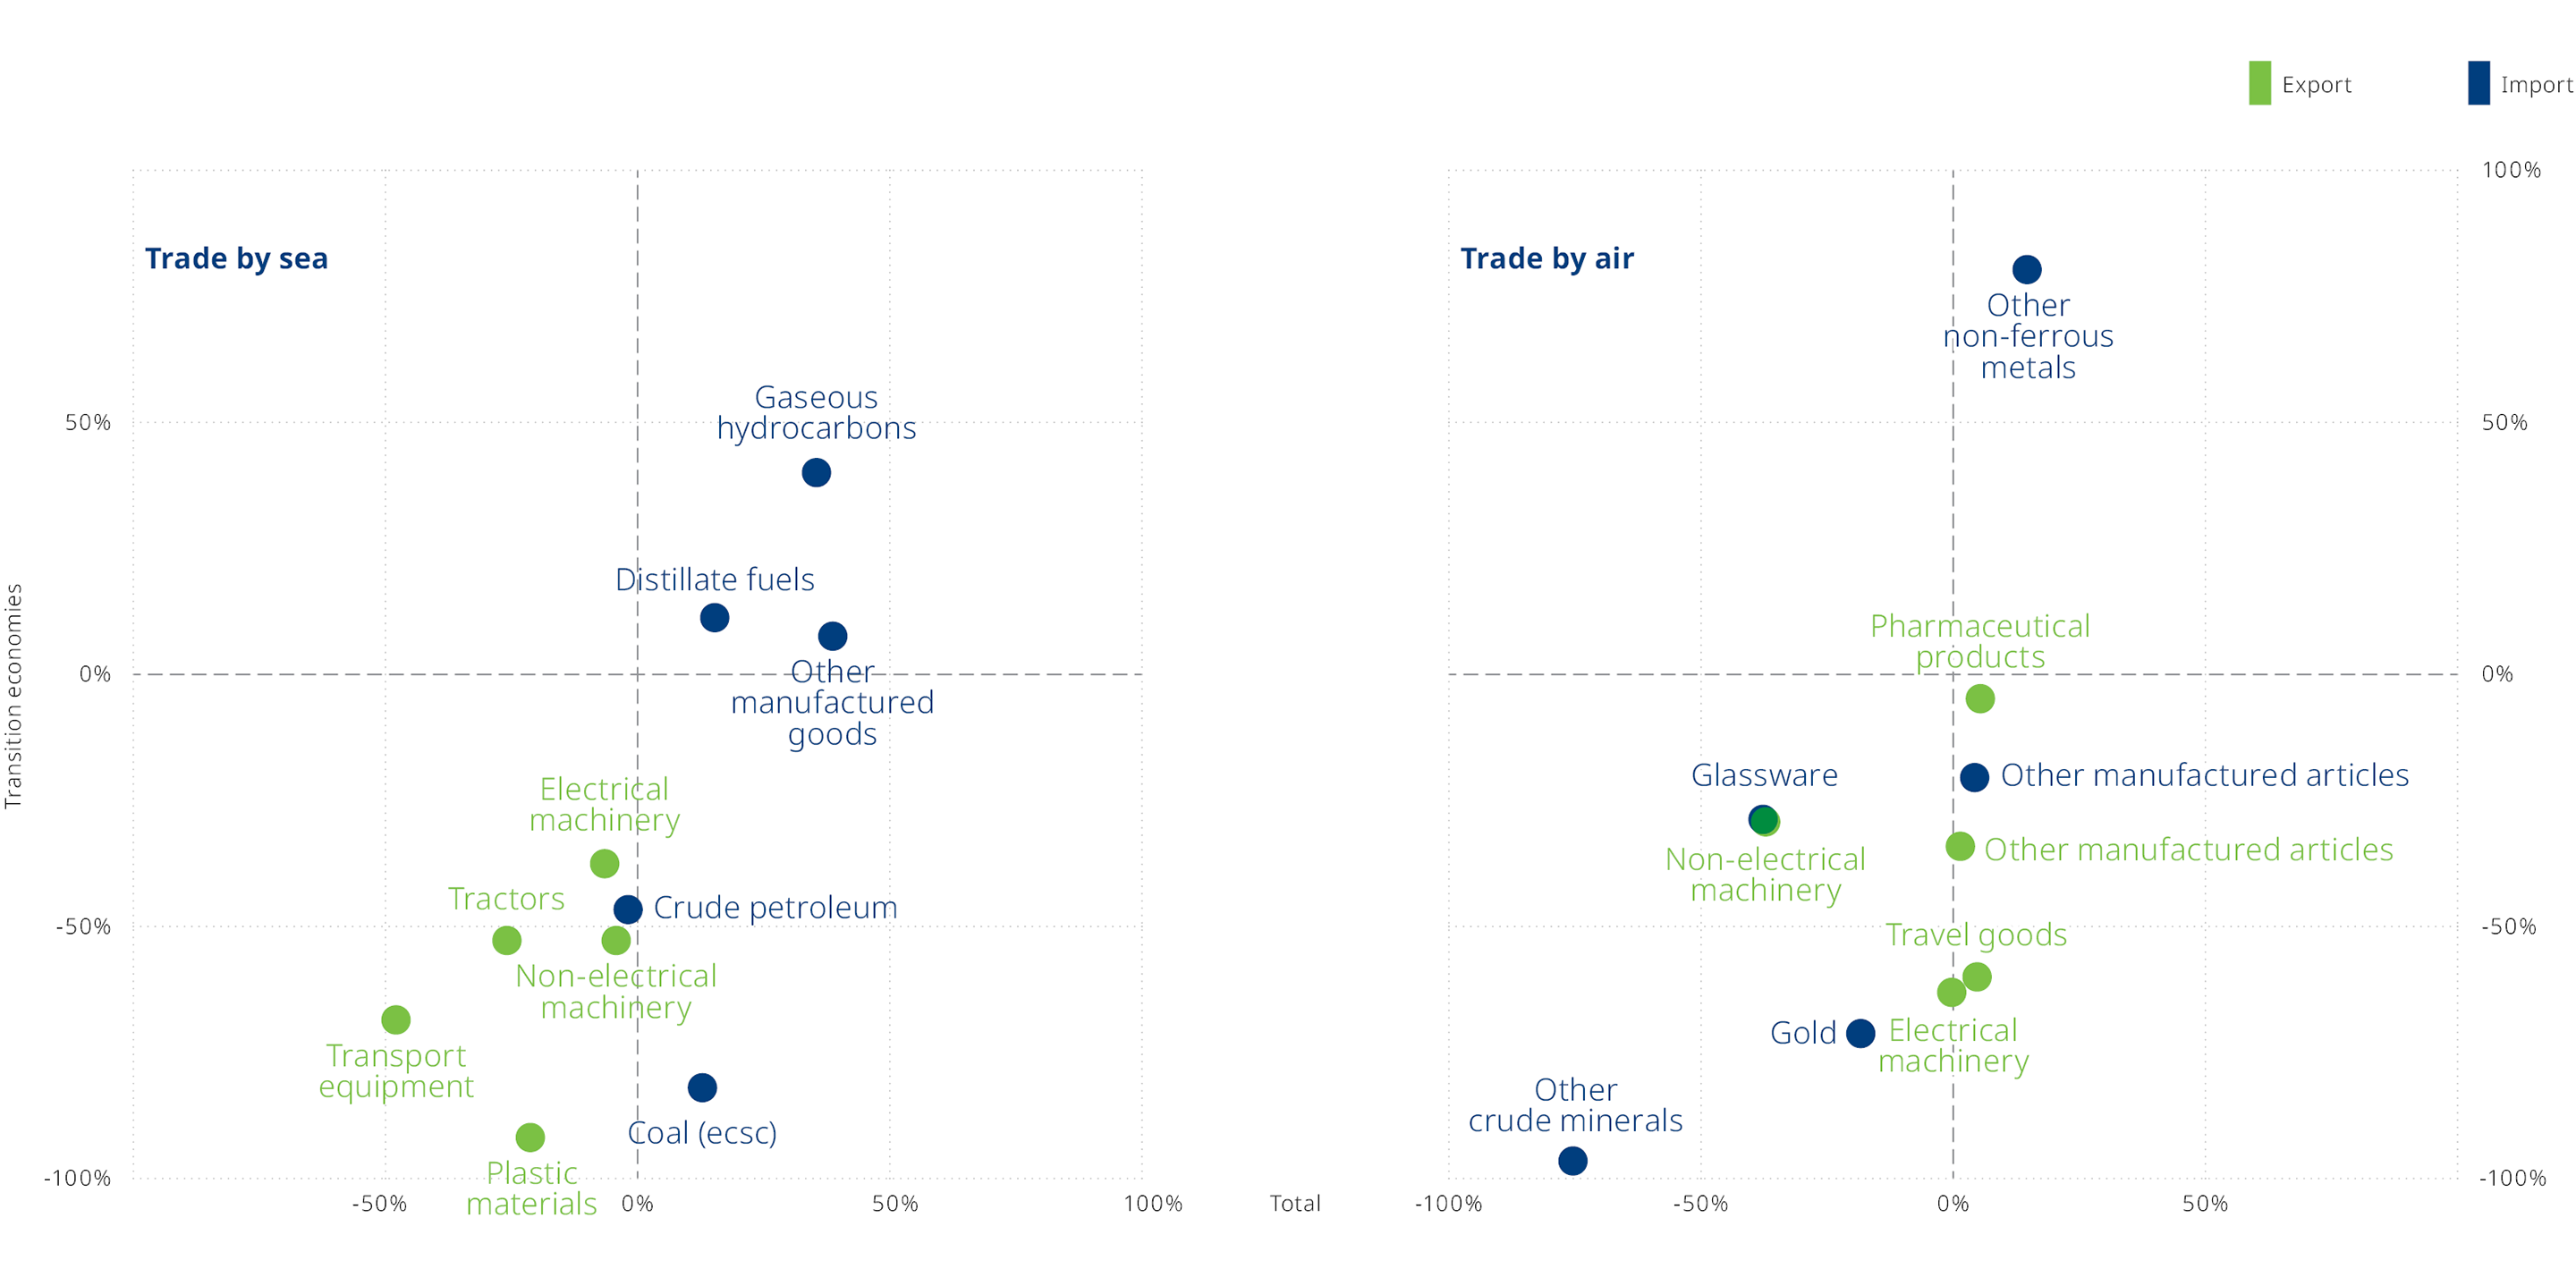
Separating air and sea trade data shows that all the most valuable airborne exports dropped by half between Q4 2021 and Q4 2022. Two of the five most valuable EU27 seaborne imports from transition economies contracted drastically: coal (81%) and crude petroleum (46%). The other three remained positive, suggesting a shift in imports from Russia to sourcing from other transition economies.
However, when looking at country-specific data, it is possible to conclude that this increase was driven by trade with Russia. These findings suggest that essential commodities, such as distillate fuels, gaseous hydrocarbons (including natural gas), and other non-ferrous metals, are still traded with transition economies despite the war in Ukraine.
Comparison of EU27 trade by air with all regions and with transition economies for the top five commodities
Percentage change between Q4 2021 and Q4 2022 (tonnes)
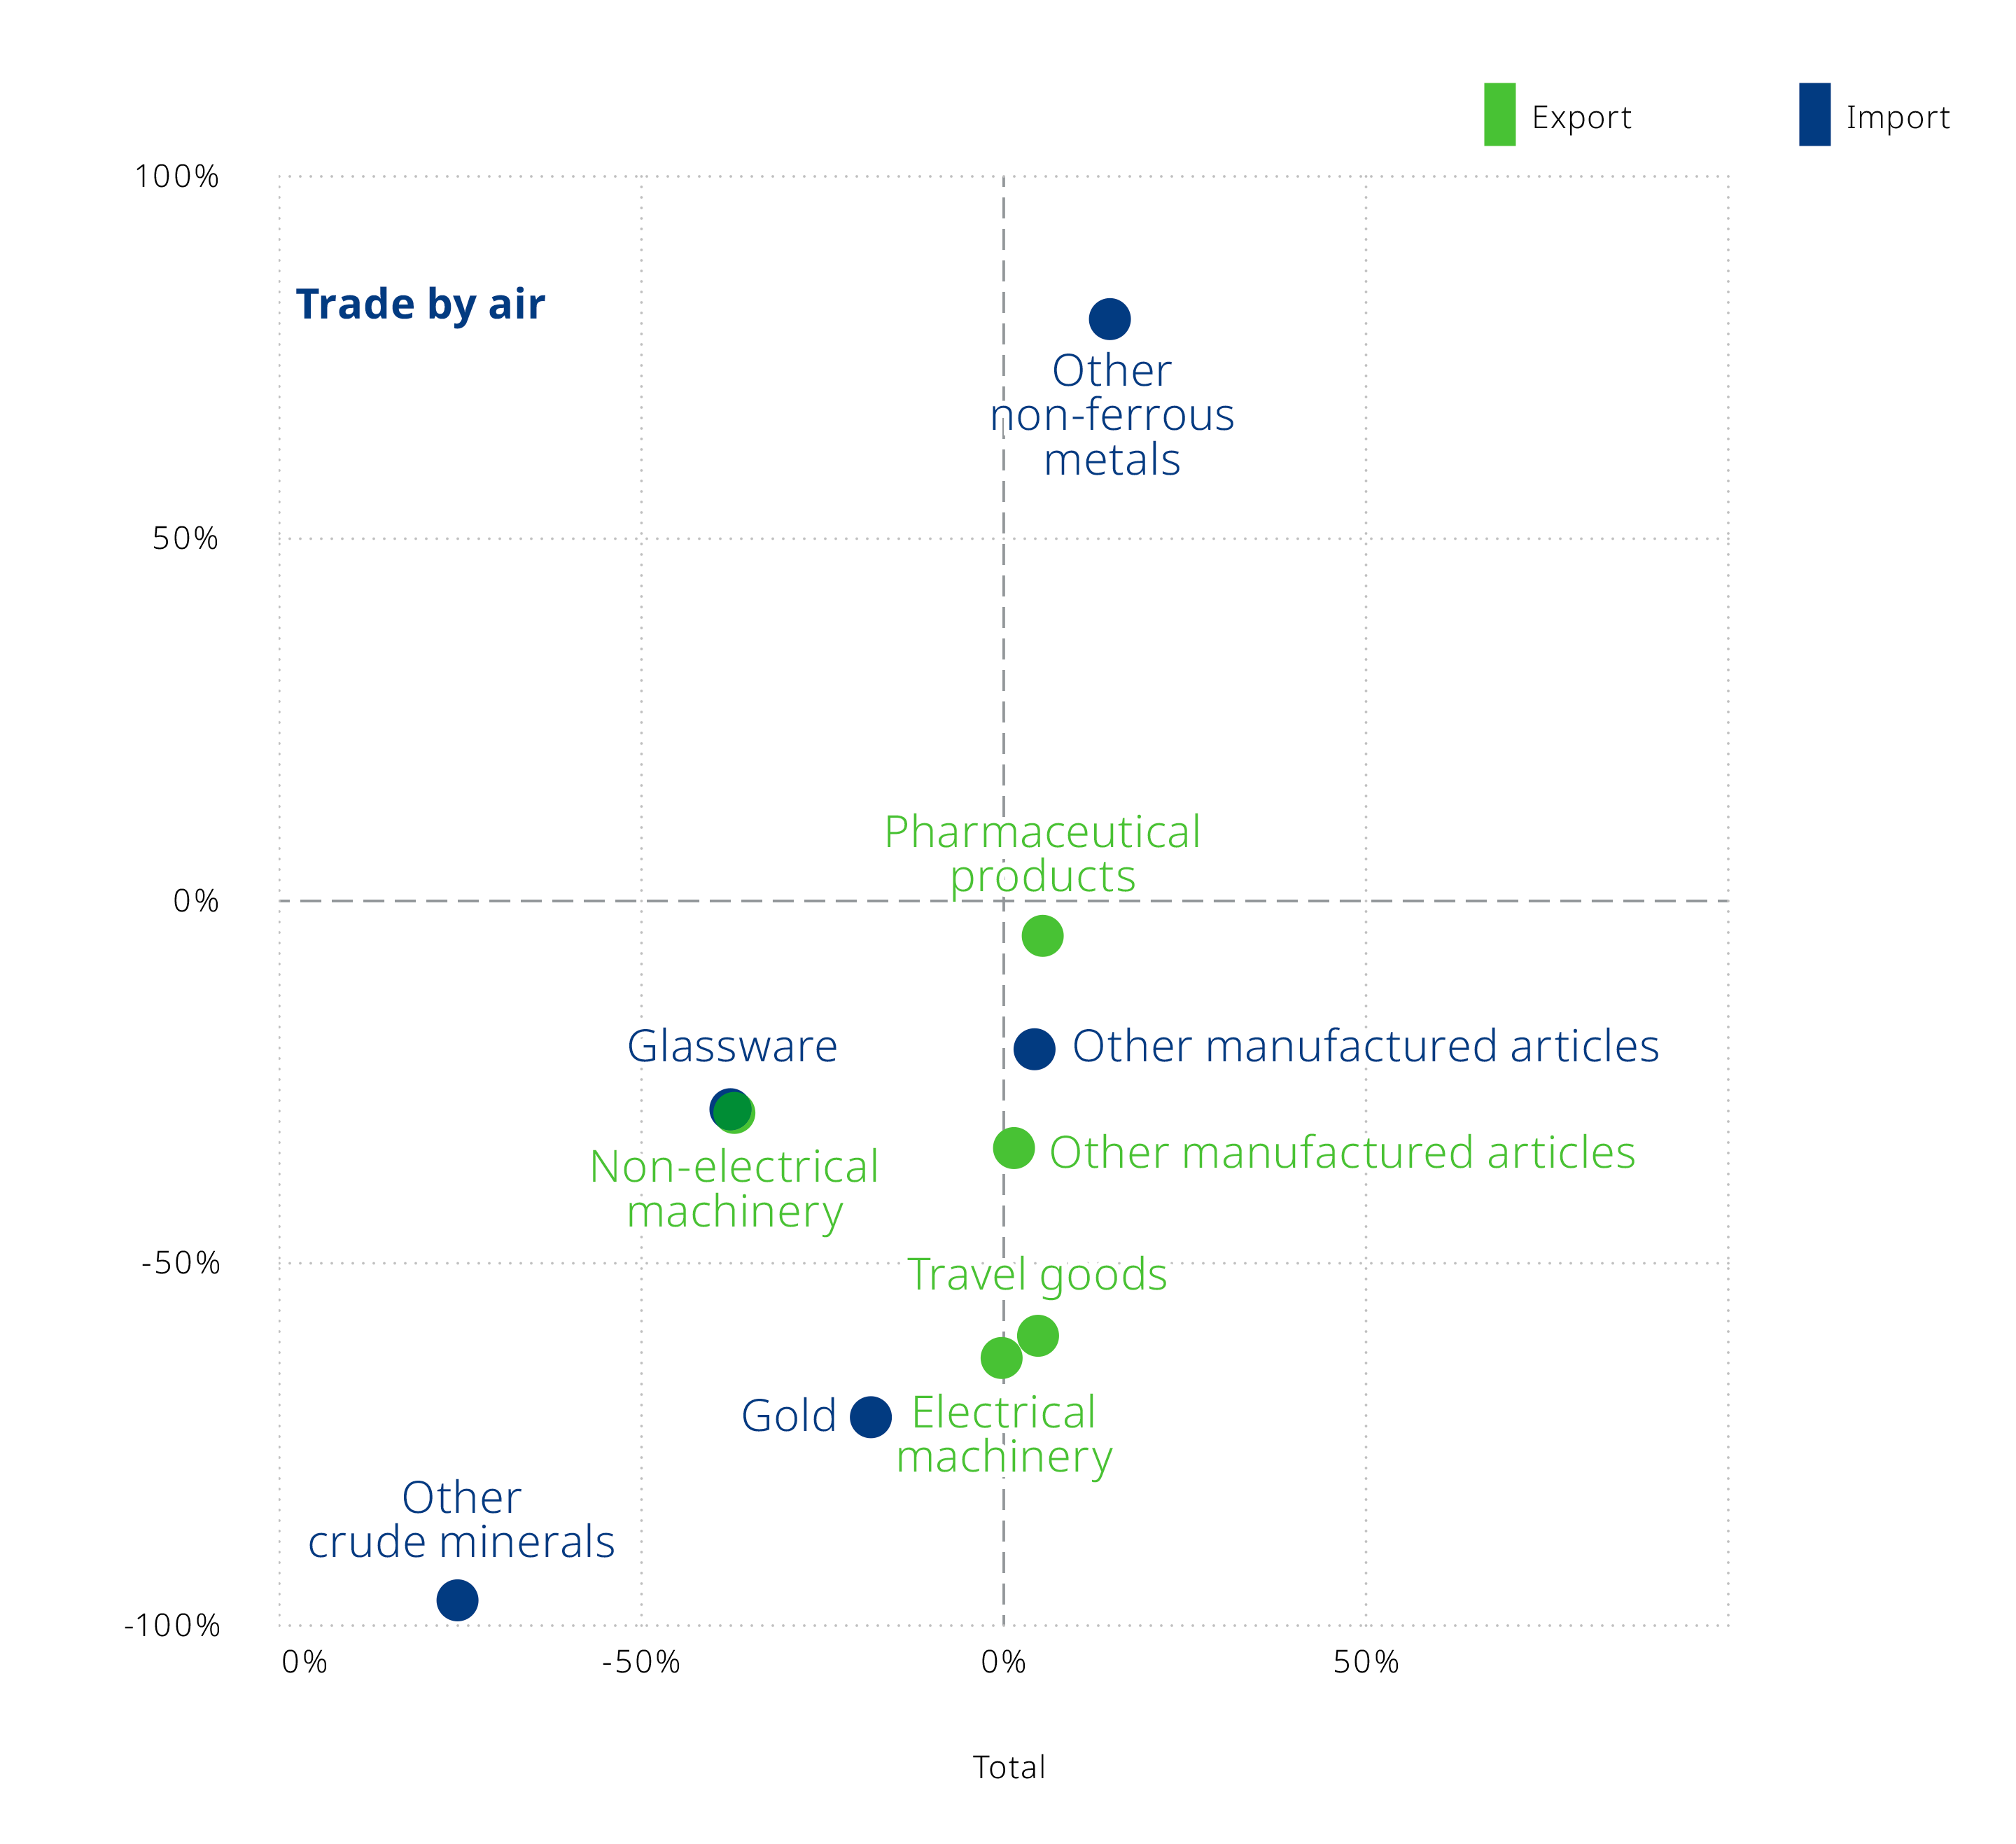
Only commodities in the "Other manufactured articles" category imported by air into EU27 from transition economies were easily replaced by other sources.
Otherwise, EU27 imports by air from all regions present mixed results when analysing only the top five commodities traded with transition economies. EU27 imports from all regions grew by 4% between Q4 2021 and Q4 2022, despite a decrease of 19% with transition economies. Other crude minerals, gold and glassware, showed less resilient supply chains as EU27 was less able to find alternative sources for these materials.
In contrast, exports by air showed high levels of resilience, experiencing only a contraction in exports to all regions of non-electrical machinery between Q4 2021 and Q4 2022. The other four commodities experienced a small increase despite reduced trade with transition economies.
Comparison of EU27 trade by sea with all regions and with transition economies for the top five commodities
Percentage change between Q4 2021 and Q4 2022 (tonnes)
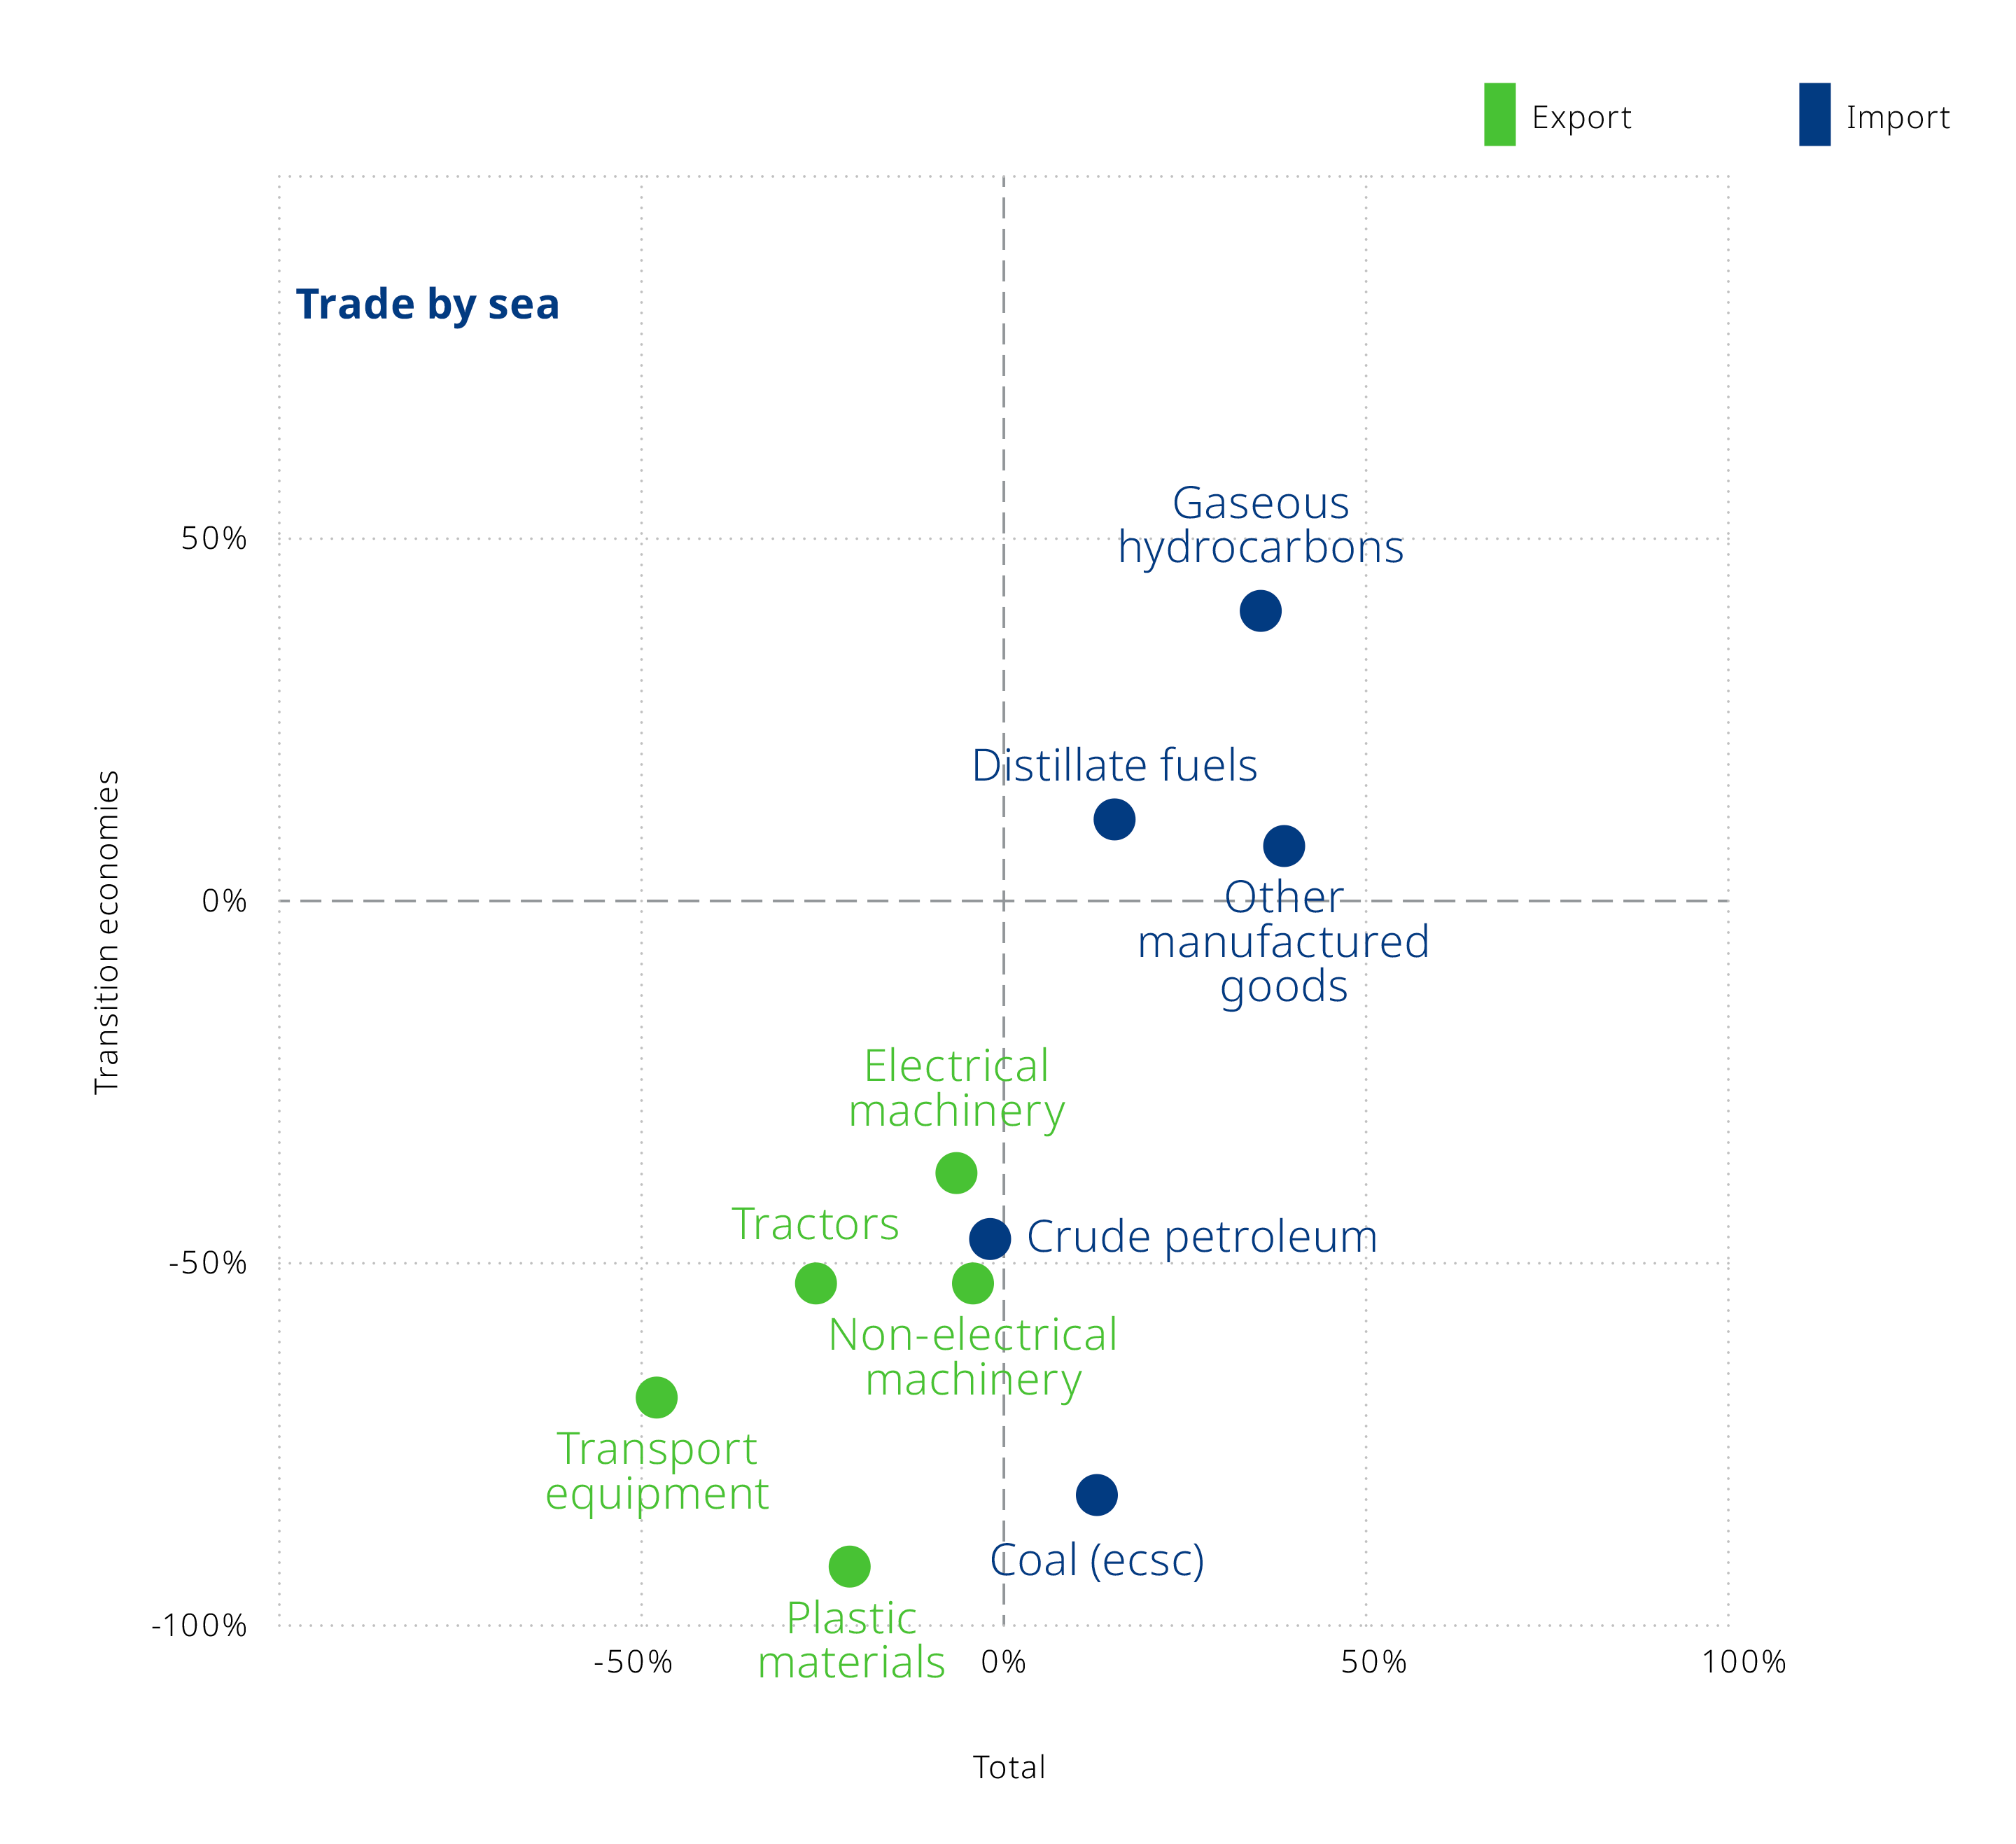
Total seaborne imports remained more or less stable for crude petroleum (1%) and even experienced an increase for the other four commodities. Since crude petroleum and coal imports from transition economies decreased while experiencing a boost with the rest of the world, it is possible to confirm that EU27 shifted trade towards other regions.
Sea imports showed a high degree of resiliency, especially when these are essential commodities for energy production and are critical inputs in other industrial processes.
Seaborne exports were less resilient than imports. Only non-electrical (3%) and electrical (6%) machinery exports remained almost stable between Q4 2021 and Q4 2022, while transport equipment (43%), plastic materials (19%), and tractors (23%) decreased when considering all commercial partners.
Strong global connectivity and supply chain adaptability allow flexible trading
The transported commodities data confirm that world markets are highly connected, and that supply chains remain resilient. This is borne out in the data showing that some reductions in the trade of some of the most affected commodities with transition economies allowed trade to shift towards other regions.
Traditional trading partners such as United States, Canada, Australia and New Zealand heavily increased their exports towards the EU27, followed by Middle East and North Africa and Sub-Saharan Africa.
Seaborne crude petroleum and coal imports from transition economies were heavily affected. However, given their importance for energy production in some EU27 countries, trade quickly shifted towards other resource-rich regions, such as LAC for crude petroleum and SSWA for coal, thus minimising the impact of trade disruptions on total trade and electricity production.
Airborne exports proved to be more resilient than imports. Three of the top five most valuable exports from EU27 to transition economies quickly found their way to other markets. Air exports of "Travel goods" (which include leather luggage and handbags) have increased since the beginning of the war even though exports to transition economies were heavily affected, shifting towards non-EU European countries, SEA and SSWA.
Other manufactured goods saw increased exports towards LAC, MENA and other non-EU European countries, while pharmaceutical airborne exports to UCAN, SEA and SSWA increased between Q4 2021 and Q4 2022.
About the statistics
Download the Statistics Brief as a visual PDF
This Statistics Brief presents the latest global freight transport trends, based on the Global Trade and Transport Database and the ITF Quarterly Transport Statistics. These data are collected by the ITF Secretariat through a questionnaire and from external sources, including Eurostat and the US Census.
In contrast to previous years, this edition uses the "Extra-EU trade since 2000 by mode of transport, by HS2-4-6 (ds-058213)" dataset from Eurostat, instead of the discontinued "Extra-EU trade 2000-2022 by mode of transport, by NST/R (ds-022469)" dataset. The ITF Secretariat seasonally adjusts national data for analytical purposes.
Short-term data is normally compiled to allow timely identification of changes in any indicator and identify possible turning points. However, monthly or quarterly transport statistics often show seasonal patterns.
Seasonal adjustment filters out fluctuations that recur with similar intensity in the same season every year. Trend, in turn, excludes also other irregular factors (e.g. strikes and weather impacts) from a time series.
A time series from which the seasonal variations have been eliminated can be used to compare data between two quarters for which seasonal patterns are different.
Seasonal adjustment is carried out with the Demetra program using the TRAMO/SEATS adjustment method. Seasonally adjusted estimates may differ from those produced by national authorities due to differences in the adjustment methodology.
The data in this Statistics Brief are as of 15 June 2023. Online datasets can be updated following countries' revisions. A detailed description of the methodology is available on the ITF website.
Disclaimer
The opinions expressed and arguments employed herein do not necessarily reflect the official views of the member countries of the ITF. This document, as well as any data and map included herein, are without prejudice to the status of or sovereignty over any territory, to the delimitation of international frontiers and boundaries, and to the name of any territory, city or area.
Date of Publication: 11 October 2023
Further information: Diego Botero and Rachele Poggi
Download the Statistics Brief as a visual PDF
