Infrastructure Investment Data Reveal Contrasts Between Countries
- Inland infrastructure investment:
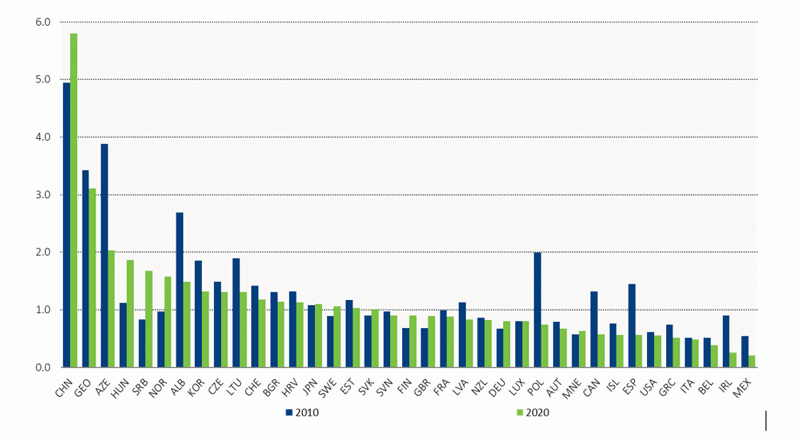
- Investment in inland infrastructure varied between 5.8% in China and 0.2% in Mexico as a percentage of GDP in 2020.
- Since 2010, investment in inland transport infrastructure grew notably in China (+0.9 percentage points as a share of GDP) and Hungary (+0.7).
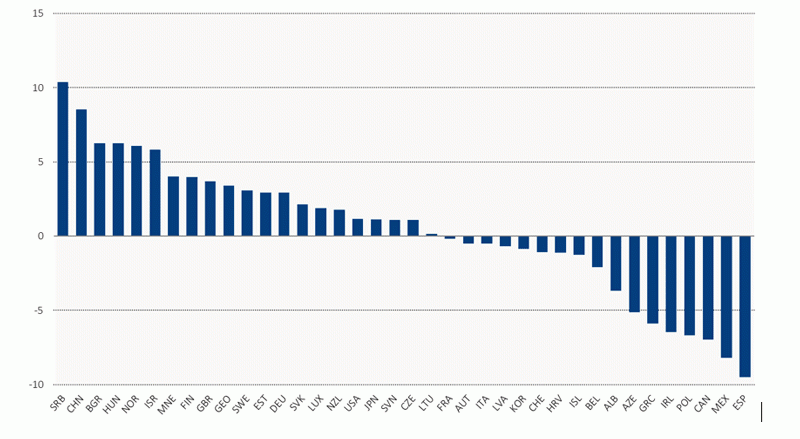
- Spain witnessed a significant drop in inland transport infrastructure investment since 2010, at a compound annual growth rate of ‑9.5%.
- Rail infrastructure investment:
- China invested EUR 92 billion (2015 constant prices) in rail infrastructure, corresponding to 0.7% of its GDP in 2020.
- Less than 20% of the total road and rail infrastructure investment is devoted to rail.
- Five countries invested more in rail than road at the end of the last decade: Austria (79% of total road and rail infrastructure investment devoted to rail), Great Britain (58%), Belgium (55%), France (54%), and Luxembourg (52%).
Subscribe to ITF Statistics Briefs
1. Inland infrastructure investment
In 2020, investment in inland infrastructure as a percentage of GDP varied between 5.8% in China and 0.2% in Mexico (Figure 1). Since 2010, inland transport infrastructure investment grew notably in China (+0.9 percentage points as a share of GDP) and Hungary (+0.7). Conversely, the most significant decreases in inland transport infrastructure as a percentage of GDP were observed in Azerbaijan (‑1.9 percentage points), Poland (‑1.3), Albania (‑1.2) and Spain (‑0.9).
Between 2010 and 2020, investment in inland transport infrastructure increased at a compound annual growth rate of 8.5% in China and 6.3% in Bulgaria and Hungary (Figure 2). On the contrary, Spain witnessed the most significant drop in inland transport infrastructure investment since 2010, with a compound annual growth rate of ‑9.5%. Other countries with significantly decreased spending include Mexico (‑8.2%), and Poland (‑6.7%).
Figure 1. Investment in inland transport infrastructure, 2010 and 2020
Percentage of GDP
Note: 2019 data used for Belgium, Canada, Georgia, Great Britain, Ireland, Italy, Japan, Korea, Montenegro, Norway, Serbia, Switzerland and United States.
Figure 2. Compound annual growth rate of investment in inland transport infrastructure between 2010 and 2020
Constant 2015 prices, per cent
Note: 2019 data used for Belgium, Canada, Georgia, Great Britain, Ireland, Italy, Japan, Korea, Montenegro, Norway, Serbia, Switzerland and United States.
2. Rail infrastructure investment
In 2018, rail infrastructure investment in 42 ITF member countries accounted for a total of EUR 193 billion (2015 constant prices), representing 0.3% of their GDP, down from 0.5% in 2010 for the same countries.
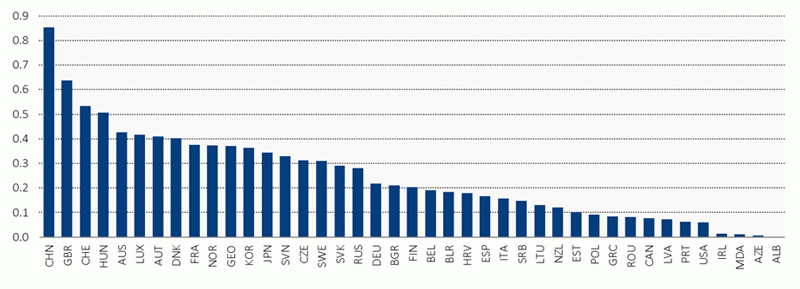
- China invested EUR 101 billion (2015 constant prices) in the rail infrastructure (Figure 3), accounting for 52% of the total 42 countries analysed, significantly outscoring other countries. These amounts represented 0.9% of its GDP (Figures 3.1 and 3.2).
- Countries in the European Economic Area + Great Britain (EEA + GB) region accounted for 26% of the rail infrastructure investment made among the 42 represented countries, reaching EUR 50 billion (2015 constant prices), representing 0.3% of the region’s GDP. In Great Britain, rail infrastructure investment accounted for 0.6% of its GDP. It was 0.5% in both Switzerland and Hungary.
- Rail infrastructure investment in the OECD Pacific countries represented 13% (EUR 25 billion) of the total 42 countries analysed, corresponding to a 0.4% share of the GDP in the region. In both Australia and Korea, rail infrastructure investment spending was 0.4% of GDP. It was 0.3% in Japan and 0.1 % in New Zealand.
- North America represented 6% of the total rail infrastructure investment (EUR 11 billion), making up 0.1% of the region’s GDP. The same level of investment as a share of GDP was observed for both the United States and Canada.
- Transition countries only accounted for 2% of the total infrastructure investment (EUR 4 billion).
Figure 3. Investment in rail infrastructure by region, 2010-2018
EUR billion (2015 constant prices)
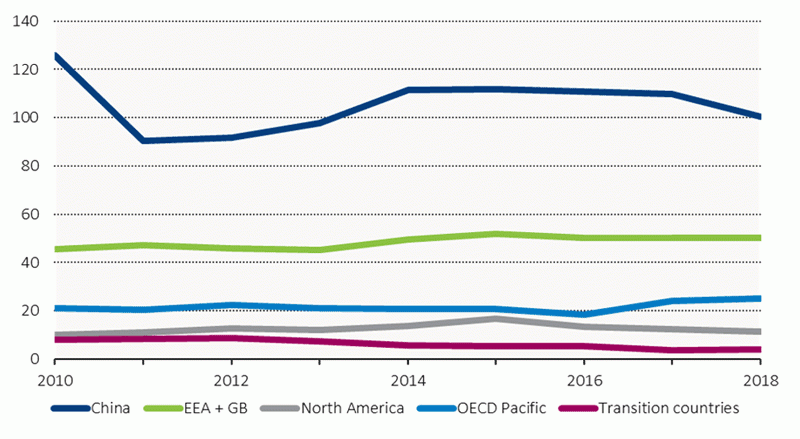
Figure 3.1. Investment in rail infrastructure by region, 2018
Percentage of GDP
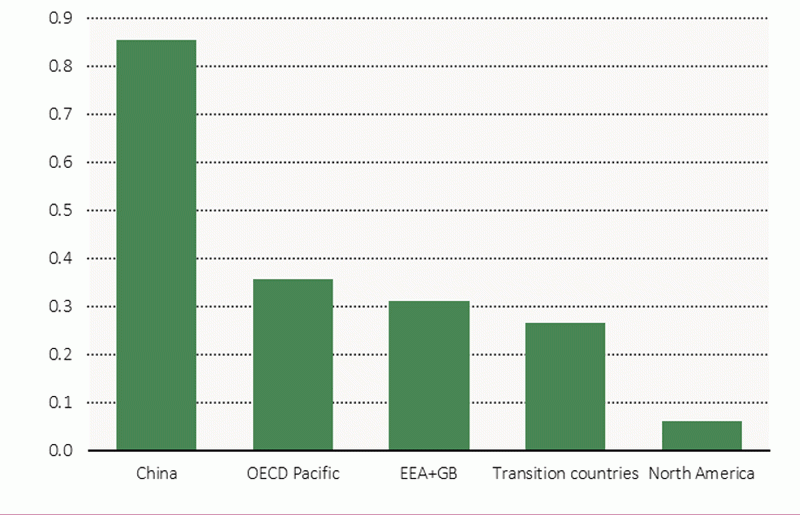
Figure 3.2. Investment in rail infrastructure by country, 2018
Percentage of GDP
3. Share of rail in total rail/road infrastructure investment
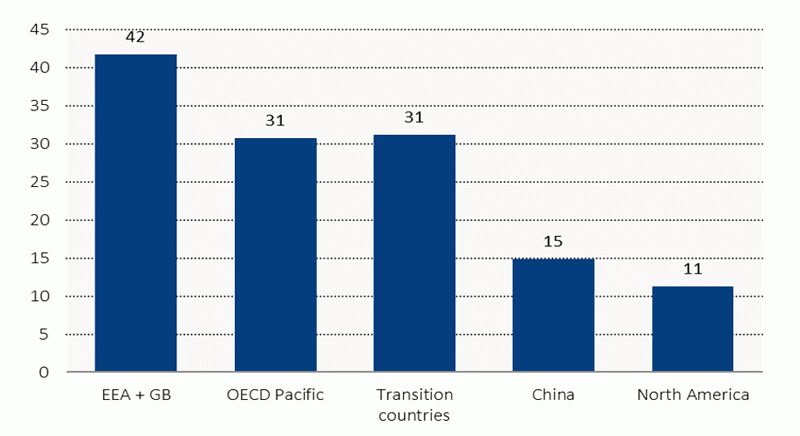
In 2018, in the 41 ITF countries with data available, the total amount spent on rail infrastructure was around EUR 193 Billion (2015 constant prices), accounting for 19% of the total rail/road infrastructure investment. Figure 4 presents the shared by region.
- EEA + GB region devoted 42% of the total rail/road infrastructure investment to rail.
- In the OECD Pacific and the transition countries, the shares of rail of the total road and rail infrastructure spending were both at 31%.
- Despite the significant amount spent on rail infrastructure, China devoted only 15% of the total rail/road infrastructure investment to rail.
- Similarly, in North America, rail represented a small share (11%) of the total rail/road infrastructure investment.
Figure 4. Share of rail in total rail/road infrastructure investment, 2018
Percentage
Annex 1: Figures
Figure 5. Investment in rail infrastructure, 2020
Percentage of GDP
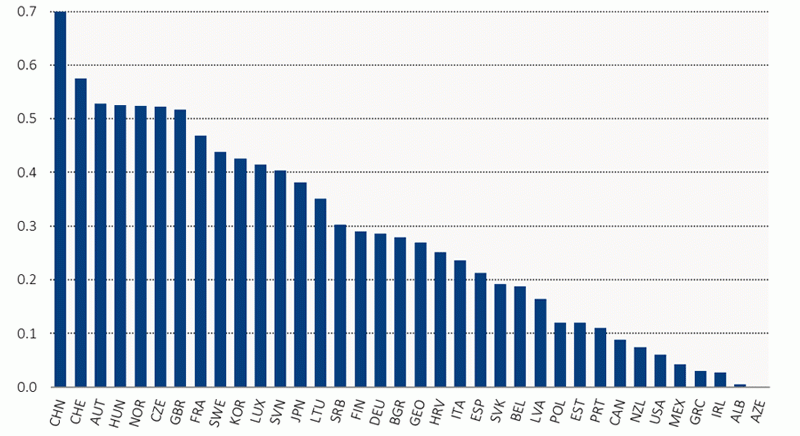
Note: 2019 data used for Belgium, Canada, Georgia, Italy, Japan, Korea, Serbia, Great Britain and the United States.
Figure 6. Compound annual growth rate of investment in rail infrastructure between 2010 and 2020
Constant 2015 prices, per cent
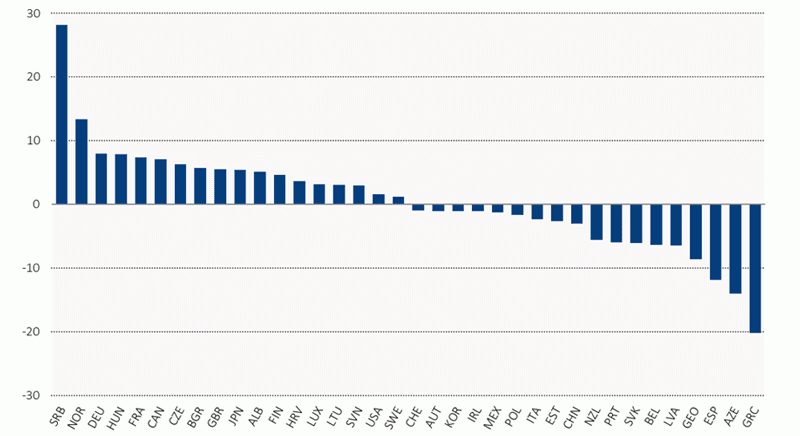
Note: 2019 data used for Belgium, Canada, Georgia, Italy, Japan, Korea, Serbia, Great Britain and the United States.
Figure 7. Share of rail infrastructure investment on total rail/road infrastructure investment, 2020
Percentage
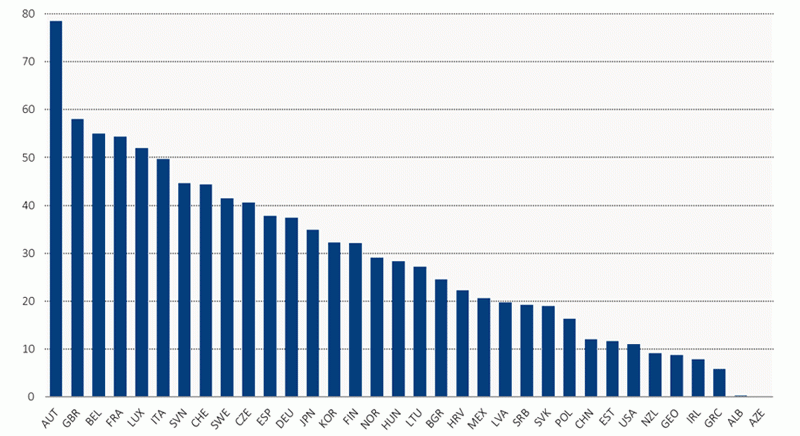
Note: 2019 data used for Belgium, Georgia, Great Britain, Ireland, Italy, Japan, Korea, Norway, Serbia, Switzerland and the United States.
About the statistics
The International Transport Forum statistics on investment, maintenance expenditure and capital value of transport infrastructure for 1995-2020 are based on a survey sent to current ITF member countries. The survey covers total gross investment (defined as new construction, extensions, reconstruction, renewal and major repair) in road, rail, inland waterways, maritime ports and airports, including all sources of financing. It also covers maintenance expenditures financed by public administrations and the capital value of transport infrastructure. Inland infrastructure investment covers rail, road and inland waterways transport modes.
The Secretariat collects data from member countries in national currencies, which are then converted to current prices and constant euros. Significant efforts have been devoted to collecting relevant deflators needed to calculate the constant euro equivalent of data provided, since there exists no purchasing power parity corrected general index for transport infrastructure investment. Where available, a cost index for construction on land and water is used. Where these indices are not available, a manufacturing cost index or a GDP deflator is used.
Despite the relatively long time series, these data are often dogged by definition and coverage inconsistencies between countries, which make international comparisons difficult. For the capital value data, in particular, there are notable differences in the precision of estimation methods. The capital value of infrastructure is most commonly estimated using historical cost accounting with the perpetual inventory method (PIM) or current cost accounting, which evaluates the current value of all assets. We therefore advise caution when making comparisons of data between countries and instead recommend comparisons of trends. Furthermore, when analysing the capital value data or indicators such as the inland transport infrastructure investment share of GDP, it is important to take into account the quality and age of existing infrastructure, the maturity of the transport system, the geography of the country, the transport-intensity of its productive sector and its transport infrastructure developments.
If you would like to receive more information about this Statistics Brief, please contact Mr Mario Barreto (mario.barreto@itf-oecd.org), Ms Aurélie Kopacz (aurelie.kopacz@itf-oecd.org) or Ms Rachele Poggi (rachele.poggi@itf-oecd.org).
Detailed country data for inland modes, maritime ports and airports, more detailed data descriptions and notes on the methodologies are available at: https://stats.oecd.org/Index.aspx?DataSetCode=ITF_INV-MTN_DATA. Please consider that the data in this brief are those as of 15 June 2022. Data on OECD.Stat can change in the future due to countries’ revisions.
Disclaimers
This document, as well as any data included herein, are without prejudice to the status of or sovereignty over any territory, to the delimitation of international frontiers and boundaries and to the name of any territory, city or area.