Inland transport infrastructure investment share of GDP remains stable in OECD
- Investment in inland transport infrastructure as a percentage of the GDP remained stable at 0.7% in the OECD during 2019.
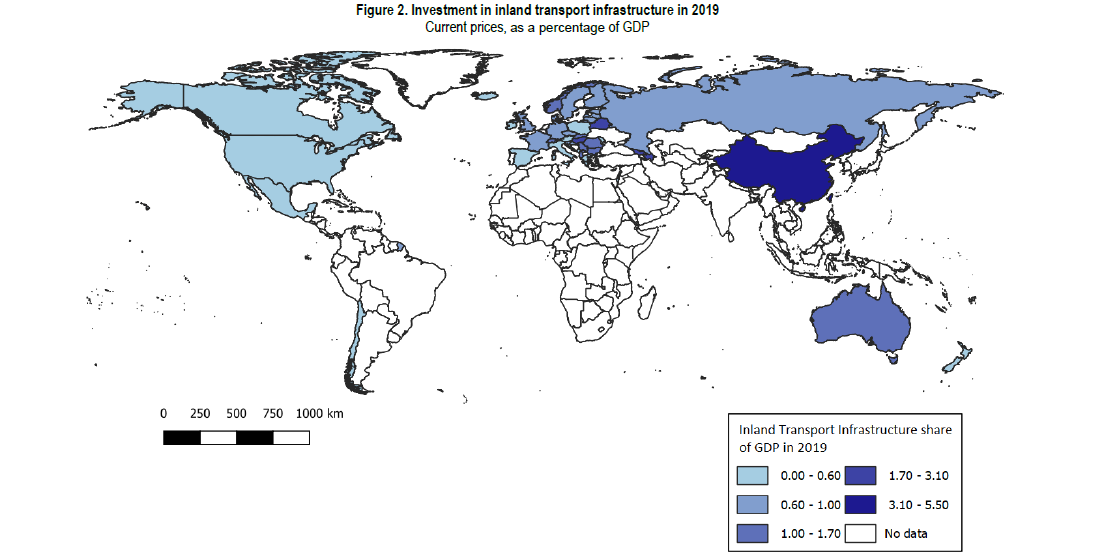
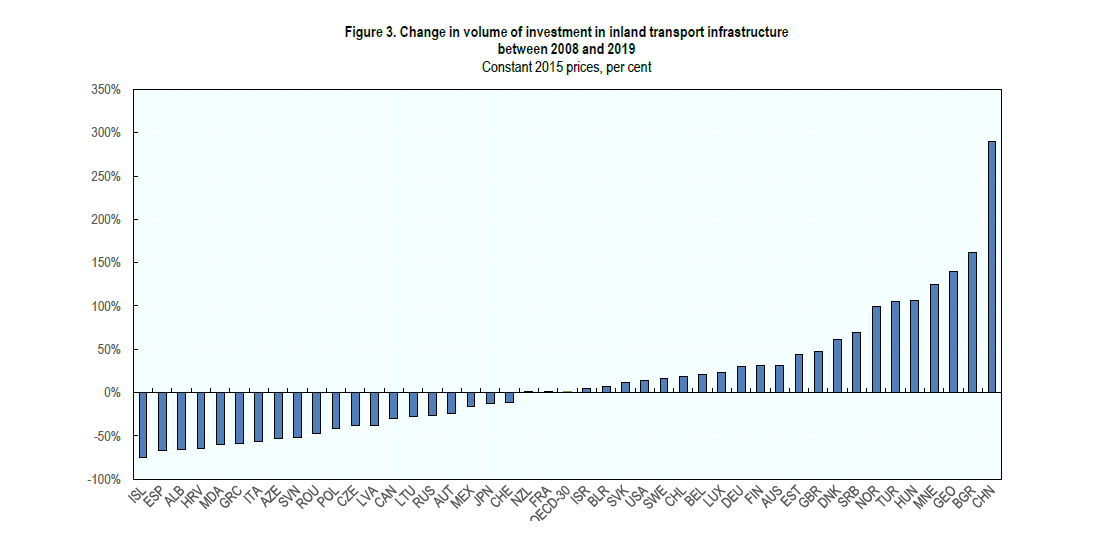
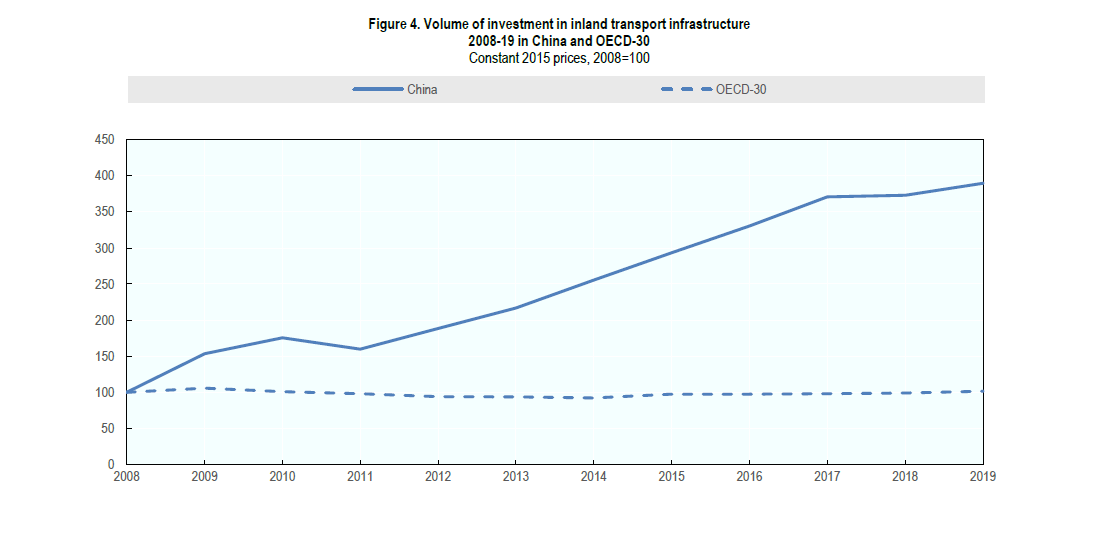
- China continued to have the highest inland transport infrastructure investment share of GDP in 2019 (5.5%) and was among the fastest-growing countries in terms of volume of inland transport infrastructure investment (+290% between 2008 and 2019 in constant 2015 prices).
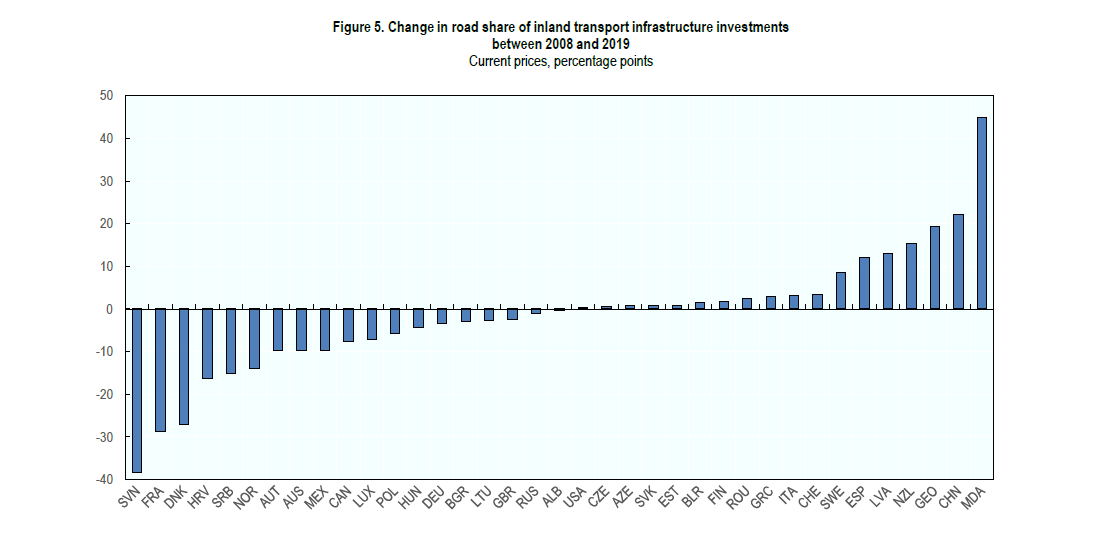
- Inland transport infrastructure investments shifted from spending on roads to spending on railways in Slovenia, France, Mexico, Canada and Luxembourg when comparing 2008 to 2019. Road share of total inland transport infrastructure declined in these countries by 38 and 28 percentage points for Slovenia and France respectively, and by nine percentage points for Mexico, and seven for both Canada and Luxembourg.
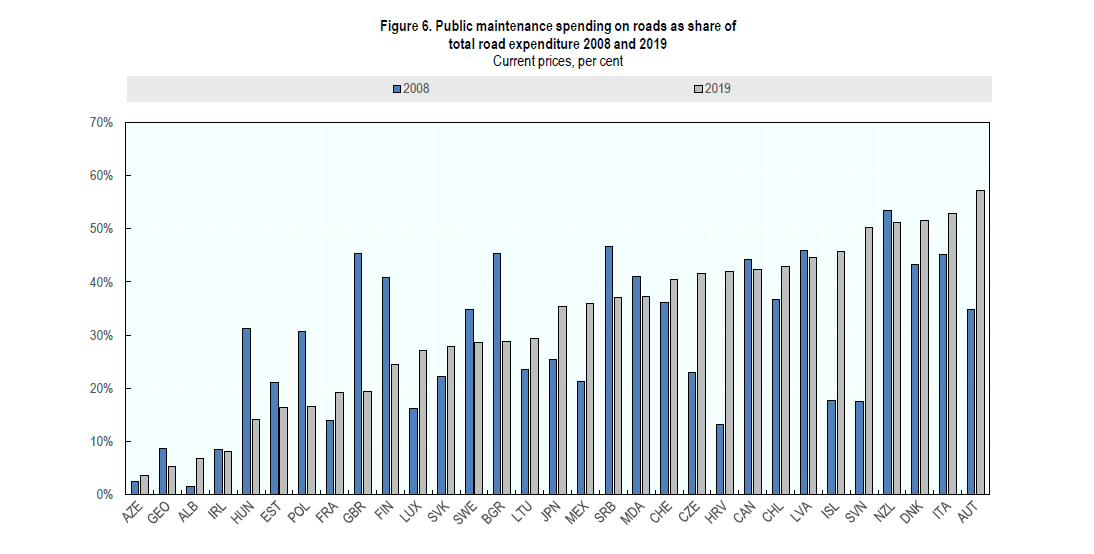
- Public maintenance spending on roads was over 50% of total road expenditure in Austria, Italy, Denmark, New Zealand and Slovenia in the latest available data.
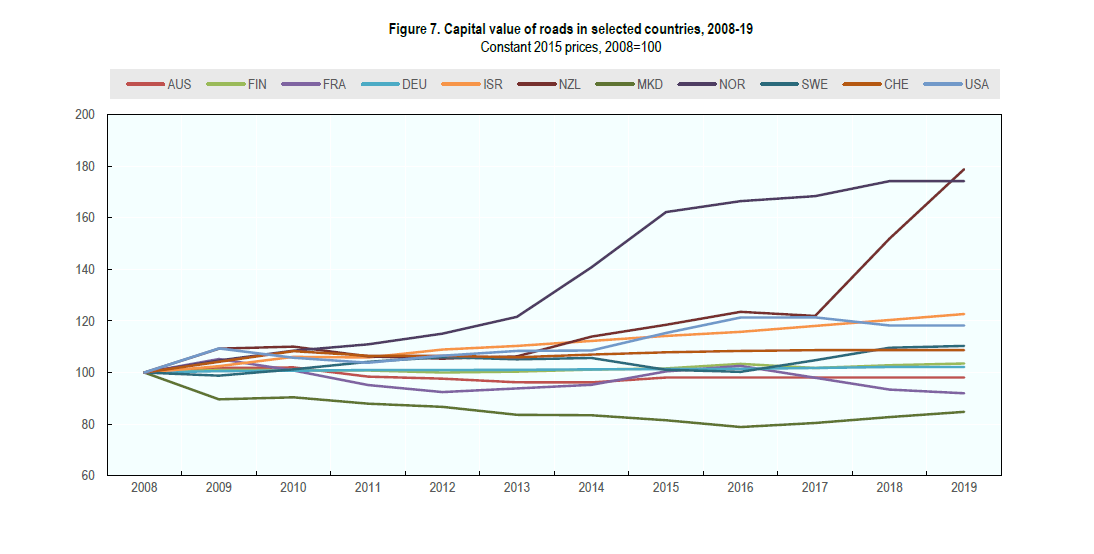
- New Zealand had the most considerable growth in capital value of roads between 2008 and 2019 among countries with available data (+79% in constant 2015 prices).
Subscribe to ITF Statistics Briefs
Investment trends for inland transport infrastructure
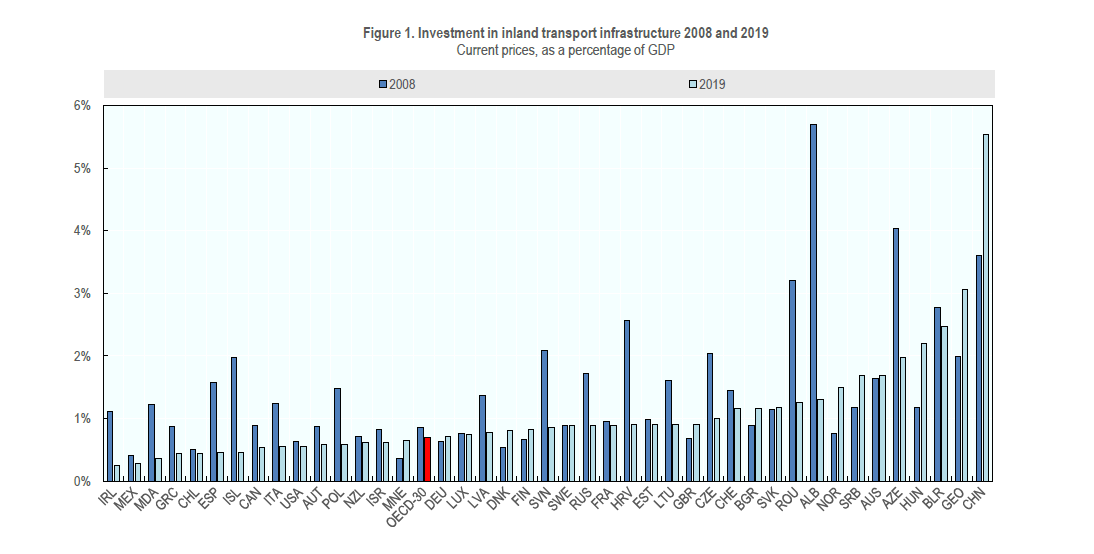
The gross fixed capital formation (investment) in inland transport infrastructure as a percentage of the Gross Domestic Product (GDP) remained stable at 0.7% in the OECD in 2019. The aggregate level has been constant since 2014, after declining from a peak of 0.9% in 2009. The OECD aggregate does not include Chile, Ireland, Israel, Korea, the Netherlands and Portugal. Also, for the aggregate calculation, data are estimated for Australia, Belgium, Canada, Denmark, Iceland, Italy, Japan, Luxembourg, Norway, Poland, Slovakia, Switzerland, Turkey and the United States.
In 2019, the highest inland transport infrastructure investment as a percentage of GDP was in China (5.5%), Georgia (3.1%), Belarus (2.5%), Hungary (2.2%), Azerbaijan (2.0%) and Serbia (1.7%); Figure 1. Since 2008, inland transport infrastructure investment shares of GDP grew most notably in China (+1.9 percentage points), Georgia (+1.1), Hungary (+1.0) and Norway (+0.7). Between 2018 and 2019, inland transport infrastructure investment shares of GDP remained stable in China and Georgia while increasing in Belarus (+0.3), Hungary (+0.3), Azerbaijan (+0.2) and Serbia (+0.4).
The lowest levels of investment in inland transport infrastructure as a percentage of the GDP among countries with 2019 data were observed in Mexico (0.3%), Greece (0.4%), Spain (0.5%) and the USA (0.6%). Since 2008, there have been declines in inland transport infrastructure investment shares of GDP in Albania (-4.4 percentage points), Azerbaijan (-2.1), Romania (-1.9), Croatia (-1.7) and Iceland (-1.5). Between 2018 and 2019, there was a decrease in investments in inland transport infrastructure shares of GDP in Greece (-0.8), Bulgaria (-0.6) and Mexico (-0.1).
Note: 2018 data used for Australia, Canada, Switzerland, Denmark, Iceland, Italy, Luxembourg, Moldova, Norway, Romania and Slovakia. Ireland and Chile data refer to road investments only.
Note: 2018 data used for Australia, Canada, Switzerland, Denmark, Iceland, Italy, Luxembourg, Moldova, Norway, Romania and Slovakia. Ireland and Chile data refer to road investments only.
China had consistent growth in inland transport infrastructure investment from 2011 to 2017 (Figure 3; constant prices). While this trend has recently begun to level off, China remains one of the fastest-growing countries for spending on inland transport infrastructure in constant 2015 prices between 2008 and 2019 (+290%; Figure 2).
Significant increases in inland transport infrastructure investments between 2008 and 2019 have also taken place in Bulgaria (+162%), Georgia (+139%), Montenegro (+124%) and Hungary (+106%). Data available until 2018 indicate strong growth in Turkey (+105%) and Norway (+100%).
The volume of investment in inland transport infrastructure in constant prices increased by only 2% in the OECD from 2008 to 2019. A decline in the volume of inland transport infrastructure investment since 2008 (in constant 2015 prices) is seen in Iceland (-75%), Spain (-67%), Albania (-66%), Croatia (-64%), Moldova (-60%) and Greece (-59%).
Note: 2018 or ulterior data used for Australia, Canada, Denmark, Iceland, Italy, Japan, Luxembourg, Moldova, Norway, Romania, Slovakia, Switzerland and Turkey.
Shifts in investments between road and rail
The share of investment in roads among total inland transport infrastructure investment grew between 2008 and 2019 in China (+22 percentage points), Georgia (+19), New Zealand (+15), Latvia (+13) and Spain (+12). It declined in Slovenia (-38 percentage points), France (-29), Croatia (-16) and Serbia (-15); Figure 5. In Azerbaijan, road spending declined (-53% since 2008 in constant 2015 prices), but the even stronger decrease in rail investment (-96%) resulted in a higher share for road investment.
Conversely, the increase in road shares of inland transport investments in Georgia and China were due to road investments nearly doubling in the former and quadrupling in the latter. Among the countries with declines in road shares of inland transport infrastructure investment between 2008 and 2019, Slovenia and France invested less in roads (-73% and -38%) and more in rail (+99% and +119%) in constant 2015 prices. Croatia’s stagnation in rail investment is coupled with a decrease in road investment (-71%), both leading to a reduction in the road share.
Note: 2018 data used for Australia, Canada, Denmark, Iceland, Italy, Luxembourg, Moldova, Norway, Romania, Slovakia and Switzerland.
Road maintenance
Efficient and timely maintenance of roads is critical to ensuring their prolonged use and the safety of road users. The ITF report “Policies to Extend the Life of Road Assets” (2018) recommends 12 measures for extending the life span of road assets.
It is essential to highlight that numbers only include public maintenance expenditure for most countries. It is near impossible for authorities to track and collect private maintenance expenditure. This gap in the data coverage can lead to misinterpretation of real maintenance levels, especially for seaports, airports and the road sector, where the private sector often covers most maintenance. Therefore, data analysis should consider trends, rather than levels. The lack of data on private road maintenance expenditure makes it difficult to verify the possible underfunding of road assets.
When looking at historical series, the available data suggests that the balance between road maintenance and investment has been relatively constant over time in all ITF countries with available data. However, there are significant variations at country level, as shown in Figure 5.
Note: 2018 data used for Canada, Denmark, Iceland, Italy, Japan, Luxembourg, Slovakia and Switzerland.
Capital value of roads
With an increase of 74% in constant 2015 prices, Norway saw the most visible growth in the capital value of roads among countries with available data between 2008 and 2019 (Figure 6). During the same period, Norway increased road investment (+68%) faster than all other countries included in Figure 6. In New Zealand, the capital value of roads grew by 78% between 2008 and 2019. Most of this growth took place since 2017 (+ 56%) and coincides with increases in road investment and road maintenance spending in constant prices between 2017 and 2019 (+18% each).
A comparison of 2008 data with the latest available figures shows increases in the capital value of roads in Israel (+23), the United States (+18), Sweden (+10%), Switzerland (+9%), Finland (+3%) and Germany (+2%). Among the countries in Figure 6, the capital value of roads declined most visibly between 2008 and 2019 in North Macedonia (-15%). Since 2008, there has been a slight decline in the capital value of roads for France of 8%.
Note: 2018 data used for Germany, Latvia, Norway and United States. 2016 data used for Australia. 2017 data used for Switzerland.
About the statistics
The International Transport Forum statistics on investment, maintenance expenditure and capital value of transport infrastructure for 1995-2019 are based on a survey sent to ITF member countries. The survey covers total gross investment (defined as new construction, extensions, reconstruction, renewal and major repair) in road, rail, inland waterways, maritime ports and airports, including all sources of financing. It also covers maintenance expenditures financed by public administrations and the capital value of transport infrastructure.
The ITF Secretariat collects data from member countries in national currencies, which are then converted to current prices and constant euros. Significant efforts have been devoted to collecting relevant deflators needed to calculate the constant euro equivalent of data provided, since no purchasing power parity corrected general index for transport infrastructure investment exists. Where available, we use a cost index for construction on land and water. Where these indices are not available, we use a manufacturing cost index or a GDP deflator.
Despite the relatively long time series, these data are often dogged by definition and coverage inconsistencies between countries, making international comparisons difficult. For the capital value data in particular, there are notable differences in the precision of estimation methods. The capital value of infrastructure is most commonly estimated using historical cost accounting with the perpetual inventory method (PIM) or current cost accounting, which evaluates the current value of all assets. We therefore advise caution when making comparisons of data between countries and instead recommend comparisons of trends. Furthermore, when analysing the capital value data or indicators such as the inland transport infrastructure investment share of GDP, it is important to take into account factors including: the quality and age of existing infrastructure; the maturity of the transport system; the geography of the country; the transport-intensity of its productive sector and its transport infrastructure developments.
If you would like to receive more information about this Statistics Brief, please contact Ms Ashley Acker (ashley.acker@itf-oecd.org) or Ms Aurélie Kopacz (aurelie.kopacz@itf-oecd.org). Detailed country data for inland modes, maritime ports and airports, plus more detailed data descriptions and notes on the methodologies, are available at this link.
OECD Aggregate
The OECD-30 aggregate does not include Chile, Ireland, Israel, Korea, Netherlands and Portugal. The following data on road or rail investment are estimated using secondary sources: Australia 2019, Belgium 2018-2019, Canada 2019, Denmark 2019, Iceland 2019, Italy 2019, Japan 2017-2019, Luxembourg 2019, Norway 2019, Poland 2013+2015-2018, Slovakia 2019, Switzerland 2019, Turkey 2018-2019, the USA 2017-2018.
Disclaimers
This document, as well as any data and map included herein, are without prejudice to the status of or sovereignty over any territory, to the delimitation of international frontiers and boundaries and to the name of any territory, city or area. The statistical data for Israel are supplied by and under the responsibility of the relevant Israeli authorities. The use of such data by the OECD/ITF is without prejudice to the status of the Golan Heights, East Jerusalem and Israeli settlements in the West Bank under the terms of international law.
