Unprecedented Impact of Covid-19 on Freight Volumes in Second Quarter
The latest update of global freight data collected by the International Transport Forum at the OECD for the period including June 2020 shows the following:
- The impact of the pandemic since April 2020 has been stark, reflected in dramatically lower air and sea freight volumes in the US and EU27.
- Air freight volumes, considered as a lead indicator for overall economic performance, were 7% lower than in June 2009 ‒ the lowest level during the global financial crisis of 2008 in the EU27.
- Exports by air were the first to drop, falling continuously since April 2020 in both the United States and the EU27. Airborne exports to BRICS and also to Asia still held up during the early months of the crisis.
- Any impact of Covid-19 on surface freight volumes is not yet visible, as data only extends to the fourth quarter of 2019.
The Covid-19 pandemic has major impact on air and sea trade, according to preliminary seasonally adjusted data (Figure 1). Air freight volumes (measured in tonnes of goods moved), a lead indicator for economic growth, decreased by 53% in the EU27 and by 3% in the United States in April 2020 compared to June 2008. Exports by air freight in particular dropped drastically as the health crisis took hold in Europe and United States.
The impact of Covid-19 on sea freight will likely become visible in the third quarter of 2020. In the EU, sea freight volumes had been stable and above the pre-2008 crisis levels from mid-2014 to March 2020. In the United States, they largely stagnated at below pre-2008 crisis levels, with 2018 as exception. However, between April and June 2020, the volume of goods moved by sea fell 4% in the EU27 and almost three times as much (11%) in the United States compared to June 2008.
Exports to BRICS countries and Asia have been the locomotive of European and North American growth since the crisis of 2008. In May 2020, exports by sea from the EU27 to BRICS were 79% above pre-2008 crisis peaks, to Asia they were 90% higher. US exports by sea to BRICS almost doubled. By contrast, air-borne exports to Asia from the EU27 and the US have slowed down as Covid-19 hit the world (Figures 2-5).
Data on the value of US trade with Mexico by rail show growth to June 2020. Similarly, EU27 trade with neighbouring countries was hardly impacted by Covid-19 until May 2020 (Figure 6). The second half of 2020 will show the cost of Covid-19 for surface freight more clearly.
Figure 1. External trade, percentage change from June 2008 (Tonnes, monthly trend, seasonally adjusted)
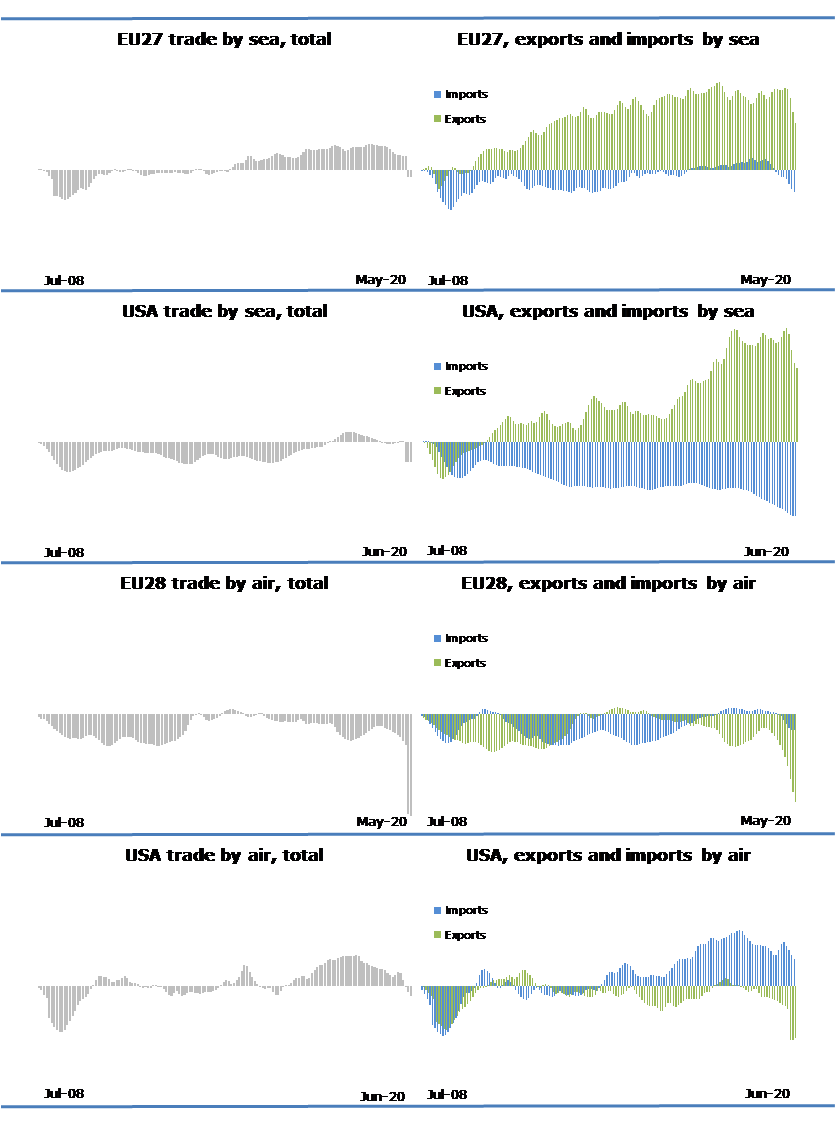
Note: Data for EU-27 trade by air exclude Germany, Estonia and the Netherlands.
Figure 2. EU-27 external trade by sea, percentage change from June 2008 (Tonnes, monthly trend, seasonally adjusted)
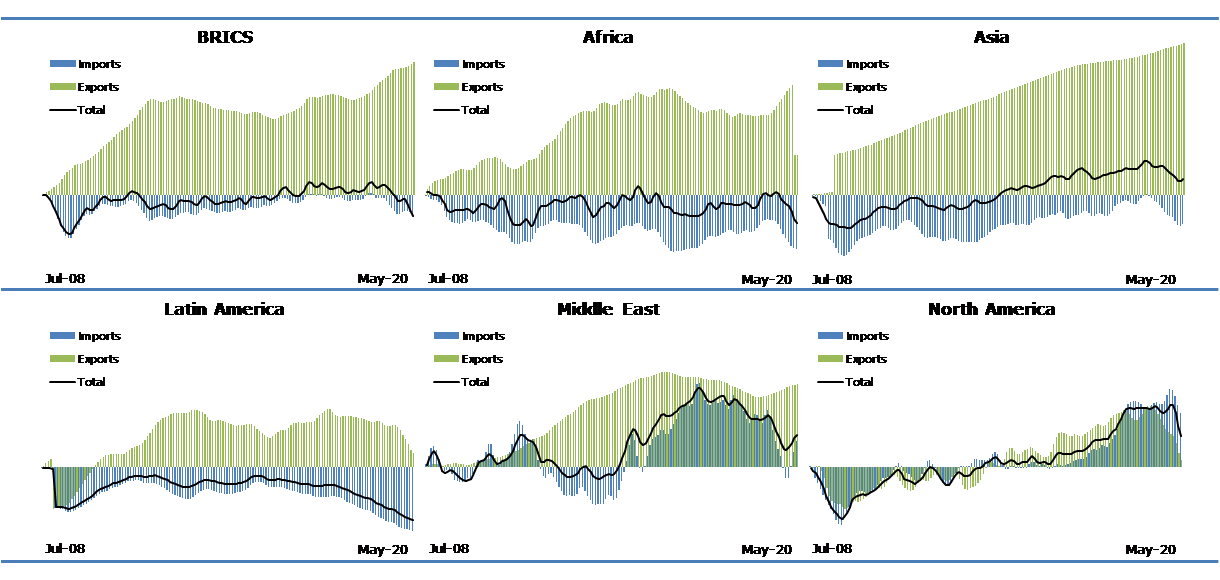
Figure 3. EU-27 external trade by air, percentage change from June 2008 (Tonnes, monthly trend, seasonally adjusted)
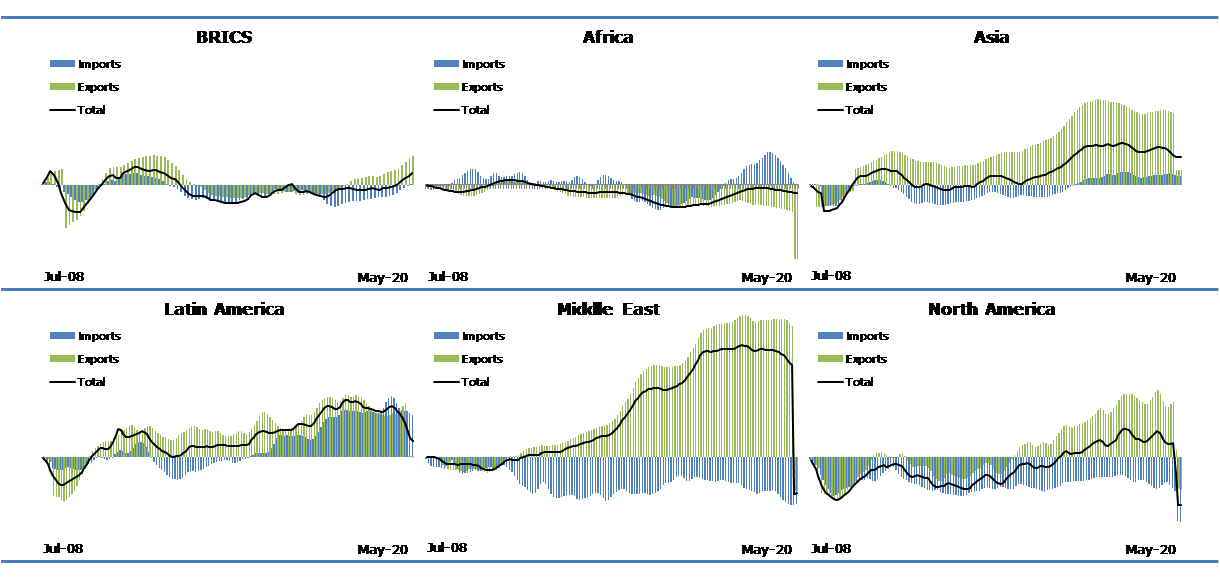
Note: Data for EU-28 trade by air exclude Germany, Estonia and the Netherlands.
Figure 4. USA external trade by sea, percentage change from June 2008 (Tonnes, monthly trend, seasonally adjusted)
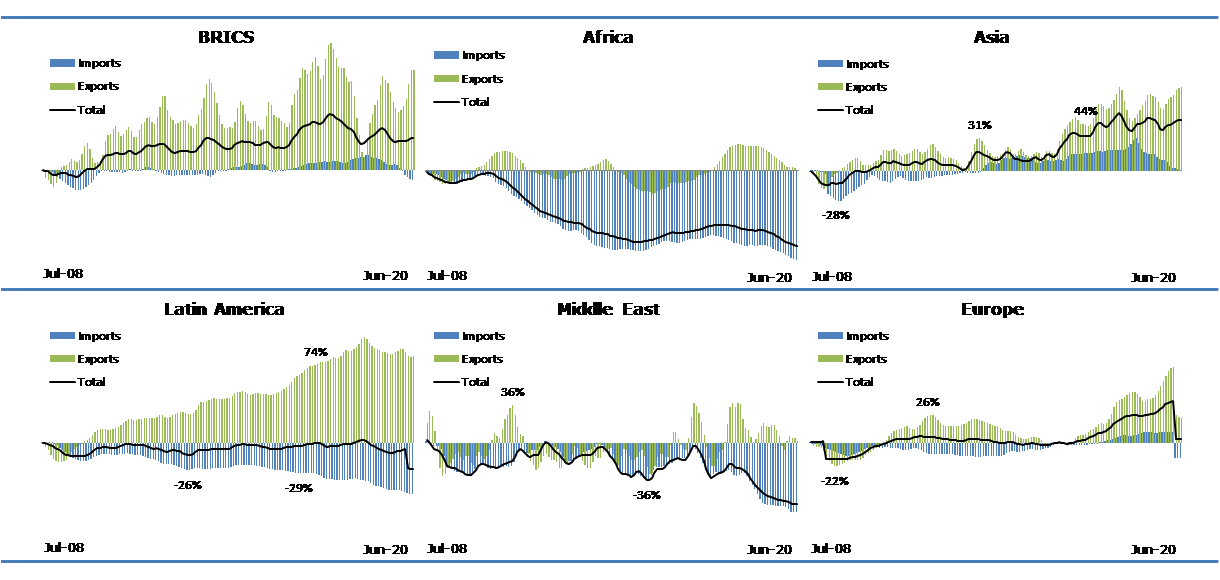
Figure 5. USA external trade by air, percentage change from June 2008 (Tonnes, monthly trend, seasonally adjusted)
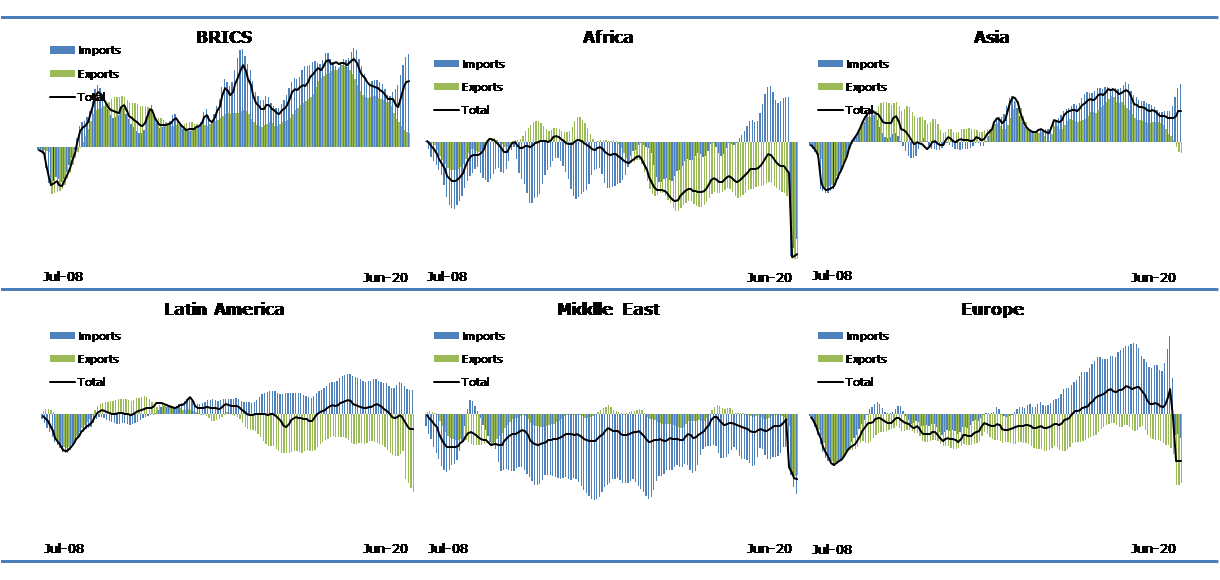
Figure 6. USA and EU27 external trade by rail and road, percentage change from June 2008 (Current values in USD / EUR, monthly trend, seasonally adjusted)
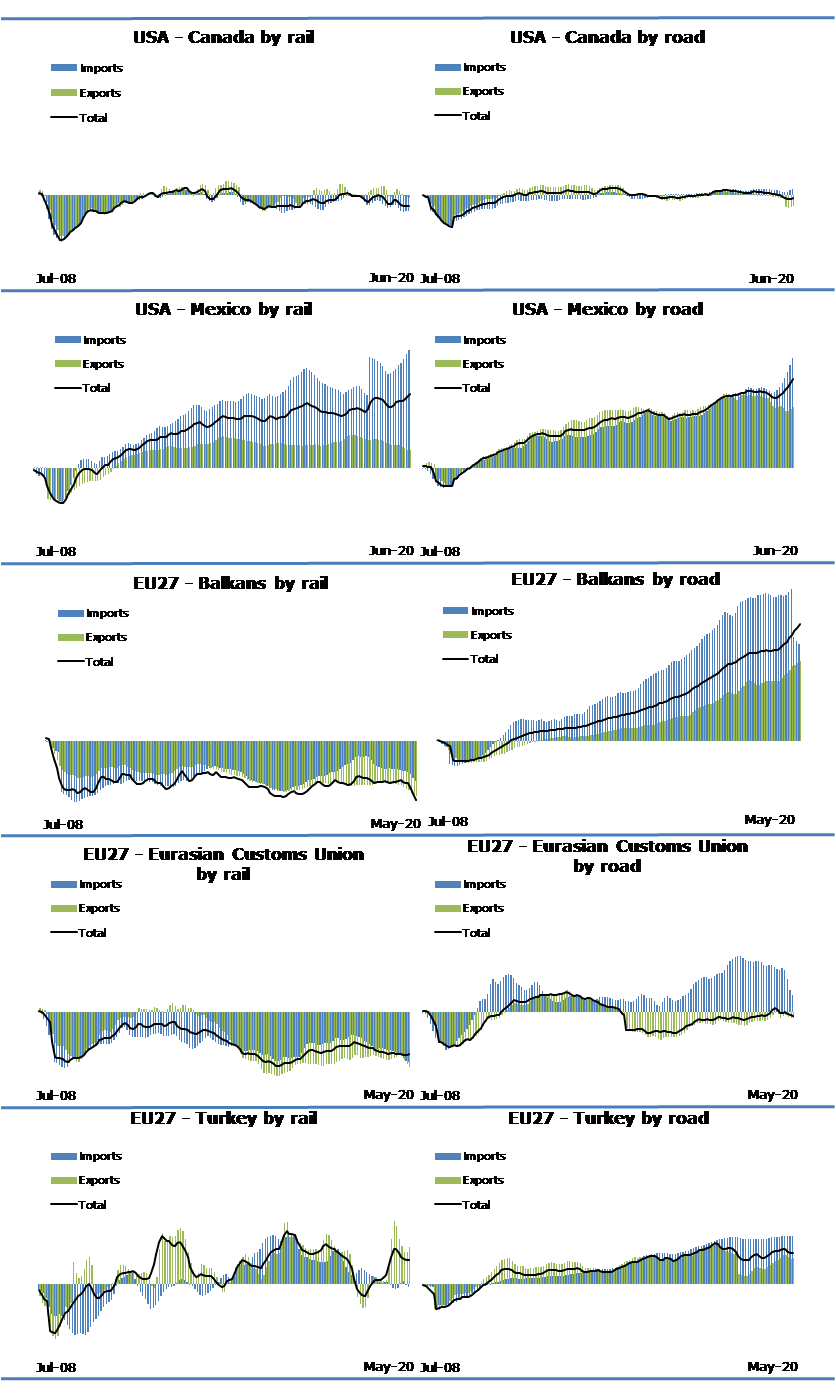
Note: Data for Balkans includes Albania, Bosnia-Herzegovina, FYROM, Kosovo, Moldova, Montenegro and Serbia.
Methodological note
The International Transport Forum Statistics Brief on Global Trade and Transport presents the latest global freight transport trends based on the Global Trade and Transport Database and the ITF Quarterly Transport Statistics. These data are collected by the Secretariat through a questionnaire and from external sources, including Eurostat, US Census and Japan Customs. National data are seasonally adjusted by the International Transport Forum Secretariat for analytical purposes.
Short-term data is normally compiled to allow timely identification of changes in any indicator and especially to identify possible turning points. However, monthly or quarterly transport statistics are often characterised by seasonal patterns. Seasonal adjustment filters out usual seasonal fluctuations that recur with similar intensity in the same season every year. Trend, in turn, excludes also other irregular factors (such as strikes and impact of weather) from a time series. A time series from which the seasonal variations have been eliminated basically allows for the comparison of data between two quarters for which seasonal patterns are different, also helping to identify turning points and the underlying direction of the change.
Seasonal adjustment is carried out with the Demetra program using the TRAMO/SEATS adjustment method. Seasonally adjusted estimates may differ from those produced by national authorities due to differences in the adjustment methodology.
For more detailed description of methodology, click here.
If you would like to receive further issues of the Statistics Brief or more information, please contact: Ms Rachele Poggi (rachele.poggi@itf-oecd.org).
For additional information on our transport statistics, go to http://stats.oecd.org/Index.aspx?DataSetCode=ITF_SHORT_TERM_INDIC