Road freight volumes continued to grow in 2020
Road freight volumes continued to grow in 2020, while goods transport by other modes slowed down compared to the 2017-2019 baseline period
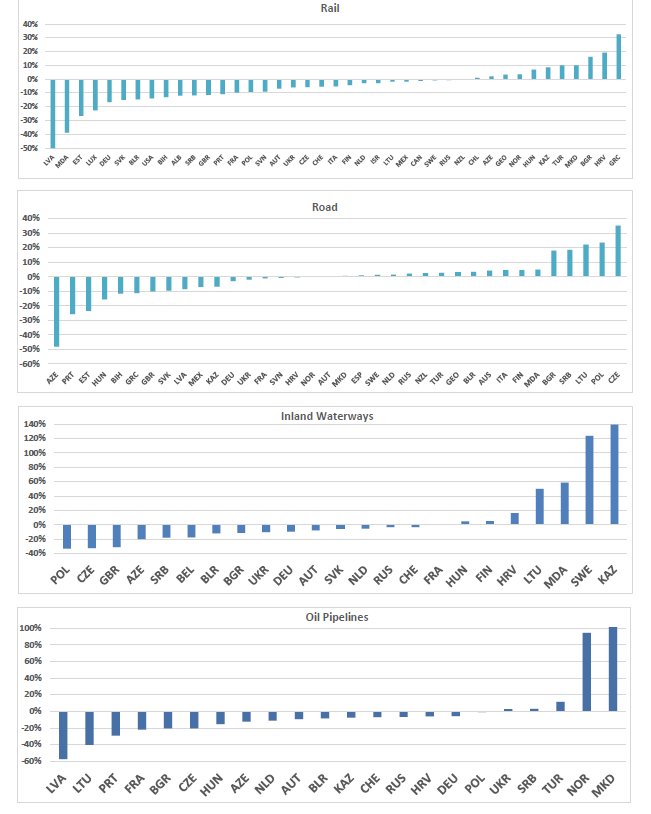
- Rail tonne-kilometres declined in almost all ITF countries with available data for 2020 (Figure 1), with the greatest decrease in Latvia (-50%).
- Road freight transport increased in most countries (Figure 1), with tonne-kilometres growing most in the Czech Republic (+35%).
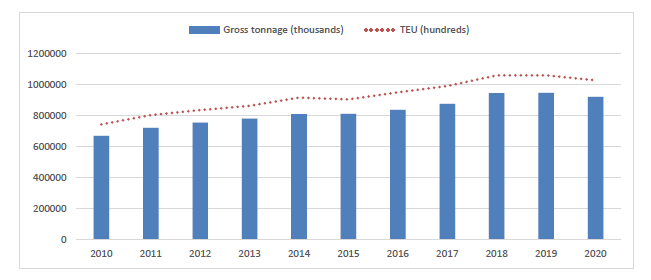
- Container shipments at seaports stabilised in 2020 compared to the 2017-2019 baseline period in OECD countries, with a slight decrease of -0.1% for gross tonnage (Figure 2), whereas it had grown between 2010 and 2019 (+42%).
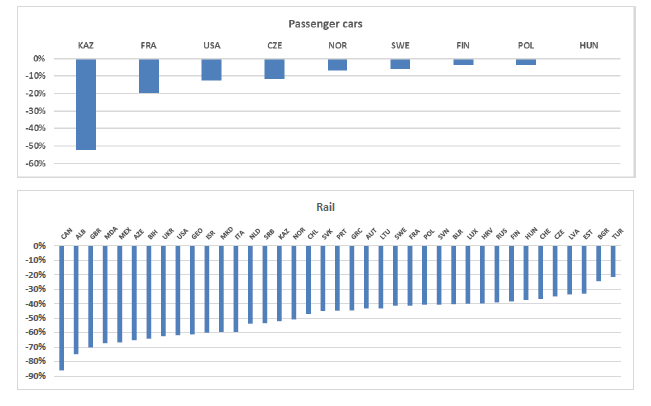
- Both rail and car passenger transport decreased in all ITF countries with available data (Figure 3), especially in Canada for rail (-86%) and Kazakstan for cars (-52%).
- Road fatalities decreased in almost all regions, most notably in European countries and Turkey (-20% on average), except in the United States (+5%).
Subscribe to ITF Statistics Briefs
Inland freight transport
Freight volumes between the pre-Covid baseline period (2017-2019) and 2020 have evolved very differently depending on the country and the transport mode.
For 29 ITF countries, rail freight contracted during the same period (-50% for Latvia, -39% for Moldova, -27% in Estonia, -23% in Luxembourg and -17% in the Netherlands). However, it increased for 12 countries in 2020 from the baseline, especially in Greece (+32%), Croatia (+19%) and Bulgaria (+16%).
Only 15 of the 36 ITF countries with available 2020 data showed a decrease in road freight, while 19 countries showed increases over the same period. Azerbaijan road freight dropped the most among ITF (-48%), followed by Portugal (-26%), Estonia (-23%) and Hungary (-16%). The Czech Republic, on the contrary, had the largest increase (+35%), followed by Poland (+23%), Lithuania (+22%), Serbia and Bulgaria (both +18%).
Inland waterway freight decreased by 33% for Poland, by 32% in the Czech Republic and by 30% in Great Britain between the baseline period and 2020. Only eight countries increased their inland waterway freight transport in 2020 with strong increases in Kazakstan (+136%) and in Norway (+124%) compared to the baseline. Inland waterway freight in Moldova and Lithuania also increased by +59% and +50%, respectively.
Oil pipeline transport increased in only five of the 22 ITF countries with available data during the same period (North Macedonia + 102%, Norway +95%, Turkey +12%). The greatest decreases were in Latvia (-58%), Lithuania (-40%), Portugal (-29%) and France (-22%).
Figure 1. Growth rate of surface freight transport between the baseline period (2017-2019) and 2020 by country, Percentage

Maritime shipping
Container shipments in seaports grew consistently between 2010 and 2019 in OECD countries, both in terms of gross tonnage and TEUs (+42%; Figure 2), with a slow down over the 2017-2019 period (+8%). On the contrary, 2020 marked a stabilisation from the baseline period of 2017-2019, as the gross tonnage decreased slightly by -0.1% between the baseline and 2020, while TEU decreased by 0.9% between the same periods.
When comparing the growth rates between 2020 and the baseline period for OECD countries, maritime gross tonnage increased in Norway (+14%), Belgium (+9%) and Turkey (+7%). TEU had the highest compound annual growth rates during the referenced period in Norway and Belgium (both +14%), Turkey (+8%) and Greece (+6%).
Figure 2. Containers loaded and unloaded in seaports in OECD countries, 2010-2020

Rail and car passenger transport
Both rail and car passenger transport decreased in all countries with available data in 2020 (Figure 3), compared to the 2017-2019 baseline period.
For car passenger transport, only nine countries among ITF countries have available data for 2020. The most significant shift in passenger car transport was in Kazakstan (-52%), France (-20%), the United States (-13%), the Czech Republic (-11%) and Norway (-7%).
Rail passenger-kilometres data are available for 39 ITF countries. The most significant decreases were in Canada (-86%), Albania (-74%), Great Britain (-70%), Moldova and Mexico (both -67%).
Figure 3. Growth rate of passenger transport by car and rail between the baseline period and 2020 by country, Percentage

Road safety
While most regions in Figure 4 succeeded in reducing the number of road fatalities since 2010, the decline has been more pronounced in 2020, undoubtedly linked to travel restrictions during the pandemic. The European Union, associated with Turkey, is the region with the most significant decrease in fatalities between 2020 and the baseline period (-20%), followed by Japan and Korea (-18%), Israel and Chile and Mexico (both -12%). The only region where road deaths increased in 2020 compared to the baseline period is USA and Canada, with a 5% increase for the whole area, led by the USA (+5% compared to -6% for Canada).
Figure 4. Road fatalities (30 days) by region,
2010-2020, 2010=100

About the statistics
The data presented in this Brief are from the ITF survey “Trends in the Transport Sector”, which includes variables on freight transport, passenger transport and road safety. Road safety data include the number of road accidents, injured, and fatalities (30 days). The data series start in 1970 and continue until the current year-1, or the most recent available data. The survey is completed by member countries, processed by ITF statisticians and published each year on 31 October.
Although there are clear definitions for all the terms used in this survey, countries might have different methodologies to calculate tonne-kilometre and passenger-kilometres. Methods could be based on traffic or mobility surveys and may use very different sampling methods and estimating techniques, which can affect the comparability of the statistics. Additionally, while the definition of road fatalities is consistent across most countries, this is not the case for road injuries. Not only do countries have different definitions, but there is underreporting of road injuries. However, data for individual countries are usually consistent over time and useful for identifying underlying trends. It is recommended to read the metadata in order to check the coverage of data for each country.
If you would like to receive more information about this Statistics Brief, please contact Ms Aurélie Kopacz (aurelie.kopacz@itf-oecd.org). Detailed data descriptions and notes on the methodologies are available at the following links:
Freight Transport: https://stats.oecd.org/Index.aspx?DataSetCode=ITF_GOODS_TRANSPORT
Passenger Transport: https://stats.oecd.org/Index.aspx?DataSetCode=ITF_PASSENGER_TRANSPORT
Road Safety: https://stats.oecd.org/Index.aspx?DataSetCode=ITF_ROAD_ACCIDENTS
Aggregates
Figure 2: Data include countries with available data for both gross tonnage and TEU for 2020 only. The OECD aggregate for both TEU and gross tonnage includes Belgium, Chile, Germany, Estonia, Finland, France, Great Britain, Greece, Israel, Italy, Lithuania, Latvia, the Netherlands, Norway, Poland, Portugal, Slovenia, Sweden and Turkey.
Figure 4: The Transition area includes Albania, Azerbaijan, Belarus, Georgia, Kazakstan, Moldova, North Macedonia, Russia and Serbia. EEA + Turkey excludes Spain, Malta, Portugal and Romania.